NHPC’s ₹26,070 Crore Hydroelectric Project: A Game-Changer for Growth?


Key Takeaways
- NHPC Ltd receives approval for a ₹26,070 crore hydroelectric project
- Project to be developed in partnership with the Arunachal Pradesh government
- Strengthens India’s renewable energy push and hydro capacity
- Long gestation period but strong long-term visibility
- Execution, funding, and timelines remain key factors
Introduction
India’s renewable energy ambitions are gaining momentum, and hydropower is once again coming into focus. In a significant move, NHPC Ltd has received approval for a ₹26,070 crore investment in the Kamala Hydroelectric Project.
This development not only strengthens NHPC’s project pipeline but also signals a broader policy push toward clean and sustainable energy. For investors, the key question is whether this project can truly act as a growth catalyst or if challenges around execution and timelines may limit its near-term impact.
Project Overview
The Kamala Hydroelectric Project will be implemented through a joint venture between NHPC and the Government of Arunachal Pradesh.
Key highlights
- Total investment: ₹26,070 crore
- Location: Arunachal Pradesh
- Structure: Joint venture model
- Objective: Expand hydroelectric capacity
Hydropower projects are capital-intensive and long-term in nature, often taking several years to become operational.
Strategic Importance of the Project
Strengthening Renewable Energy Portfolio
Hydropower plays a crucial role in balancing renewable energy sources like solar and wind. Unlike intermittent sources, hydro provides stable and flexible power.
For NHPC, this project enhances its position as a leading player in India’s renewable energy ecosystem.
Government Policy Support
India has been actively promoting renewable energy through policy initiatives and incentives. Large-scale hydro projects are now being recognized as an essential part of this transition.
Approvals from bodies like the Cabinet Committee on Economic Affairs reflect strong government backing for such investments.
Regional Development
Projects in the Northeast region contribute to:
- Infrastructure development
- Employment generation
- Improved connectivity
This aligns with the government’s broader focus on regional growth.
Impact on Indian Stock Market
Positive Signals for Investors
The project sends a strong message about NHPC’s growth ambitions.
- Expands long-term revenue visibility
- Reinforces leadership in hydro power
- Aligns with India’s clean energy goals
Such developments often improve investor sentiment, especially in PSU and energy stocks.
Sectoral Impact
The announcement may have a broader impact on:
- Renewable energy companies
- Power equipment manufacturers
- Infrastructure and EPC players
As hydro projects scale up, ancillary industries also benefit.
Financial Implications
High Capital Investment
A project of this scale requires significant funding.
- Potential increase in debt levels
- Long payback period
- Gradual revenue realization
Investors should be mindful that returns from such projects are not immediate.
Revenue Visibility
Once operational, hydro projects generate stable and predictable cash flows. This makes them attractive from a long-term perspective.
Risks to Consider
Execution Risk
Large infrastructure projects often face delays due to:
- Land acquisition challenges
- Environmental clearances
- Logistical constraints
Cost Overruns
Inflation in raw materials and delays can increase project costs, impacting profitability.
Regulatory and Environmental Factors
Hydropower projects require multiple approvals and are subject to environmental scrutiny, which can affect timelines.
Real-World Context
Globally, countries are increasingly investing in hydroelectric power as part of their renewable energy mix. In India, companies like NHPC are at the forefront of this transition.
With rising electricity demand and a push for clean energy, hydro projects are expected to play a key role in ensuring grid stability.
Investor Perspective
Short-Term View
- Limited immediate earnings impact
- Possible neutral to mild positive market reaction
Long-Term View
- Strong revenue visibility once operational
- Strategic alignment with energy transition
- Potential for steady cash flows
Investors with a long-term horizon may find such projects attractive.
Regulatory Framework
Projects of this scale operate under strict regulatory oversight. Institutions like the Securities and Exchange Board of India ensure transparency for listed companies, while government approvals add credibility to large investments.
What Should Investors Do?
Investors should take a balanced approach.
- Evaluate NHPC’s overall project pipeline
- Monitor funding strategy and execution progress
- Consider long-term potential rather than short-term gains
Hydropower investments are typically suited for patient investors.
FAQs
What is the size of NHPC’s new project?
The project involves an investment of ₹26,070 crore.
Where will the project be developed?
It will be developed in Arunachal Pradesh through a joint venture.
Is this project positive for NHPC stock?
It is positive from a long-term perspective but may not have an immediate impact on earnings.
What are the key risks?
Execution delays, cost overruns, and regulatory challenges are the main risks.
Should investors invest in NHPC now?
Investors should consider their risk appetite and investment horizon before making a decision.
Conclusion
NHPC’s ₹26,070 crore hydroelectric project reflects a strong commitment to India’s renewable energy future. While the scale of the investment is impressive, the benefits will unfold gradually over time.
For investors, this is not a short-term trigger but a long-term structural story. Tracking execution, funding, and policy developments will be key to understanding the real impact.
Navigating such opportunities requires the right guidance and tools. With SEBI registration, robust research capabilities, advanced technology, and a strong focus on investor education, Swastika Investmart empowers you to make informed investment decisions.
Big Budget


.webp)
.webp)
.webp)
.webp)
.webp)


.webp)
.webp)
.webp)
.webp)
Latest Articles
.webp)
Market Set-Up for 20 January 2026: What Traders Should Watch Today


Summary
- Global cues are mixed as US markets remain closed while Dow futures trade weak
- Nifty hovers near a crucial support zone around 25470 with resistance near 25700
- FII cash selling continues but derivative data shows mixed positioning
- Bank Nifty shows relatively better structure with strong support near 59500
- Volatility remains elevated, calling for disciplined and data-backed trading
Market Set-Up for 20 January 2026: What Traders Should Watch Today
Indian equity markets head into the 20 January 2026 trading session with mixed global cues and heightened domestic volatility. With the Union Budget approaching and derivatives positioning becoming more active, traders and investors need to stay focused on key levels, flows, and risk indicators rather than short-term noise.
This market set-up analysis breaks down global triggers, FII and DII activity, F&O data, and technical levels for Nifty and Bank Nifty, helping market participants plan their day with clarity.
Global Market Overview
Overnight global signals provide a cautious backdrop for Indian markets today.
US equity markets remained closed on Monday due to Martin Luther King Jr. Day, resulting in lower global liquidity. However, Dow futures slipped nearly 435 points, indicating risk-off sentiment among global investors.
Asian markets opened on a mixed note, reflecting uncertainty around global growth and interest rate trajectories. Meanwhile, GIFT Nifty traded marginally higher, offering limited directional cues for Indian equities at the opening bell.
In such conditions, domestic factors like institutional flows and derivatives data tend to play a larger role in intraday direction.
Institutional Flow Analysis: FII and DII Activity
Institutional participation continues to shape market behavior.
Cash Market Activity
- Foreign Institutional Investors sold equities worth ₹3263 crore
- Domestic Institutional Investors stepped in with purchases worth ₹4234 crore
- Net institutional flow remained positive at ₹971 crore
This divergence highlights a familiar trend where domestic money continues to cushion market declines even as foreign investors stay cautious amid global uncertainty and currency volatility.
For retail investors, this reinforces the importance of tracking DII behavior, especially in phases of FII outflows.
F&O and Volatility Snapshot
Derivatives data offers important clues about market expectations.
Key Indicators
- Nifty Put Call Ratio stands at 0.77, largely unchanged from the previous session
- India VIX jumped to 11.83, up 4 percent, signaling rising volatility
- Highest open interest is seen at 25800 Call and 25500 Put
- Max pain level for the current expiry is placed at 25600
These numbers suggest a range-bound but volatile market, where sharp intraday moves cannot be ruled out.
FII Positioning in Index Derivatives
FII activity in index derivatives shows a mixed stance:
- Increase in futures short positions
- Aggressive call writing indicating resistance at higher levels
- Simultaneous build-up in put positions, suggesting hedging rather than outright bearish bets
Such positioning usually results in choppy markets with sharp reactions to news or technical triggers.
Technical Outlook for Nifty
Nifty is currently trading near a crucial previous swing low, making today’s session technically important.
Key Levels to Track
- Immediate support lies at 25470
- Below this, the next supports are placed near 25315 and 25150
- On the upside, any recovery is likely to face resistance near 25700 followed by 25870
If Nifty manages to hold above 25470, short covering could trigger a pullback rally. However, a decisive break below this zone may invite fresh selling pressure, especially in index-heavy sectors.
For traders, this is a session where risk management matters more than prediction.
Bank Nifty Outlook: Relatively Stronger Structure
Compared to Nifty, Bank Nifty continues to display better technical resilience.
Support and Resistance Zones
- Immediate support is seen near 59500
- Additional supports are placed at 59200 and 58800
- On the upside, hurdles remain near 60000 and 60400
Private banking stocks have shown selective buying interest, which could help Bank Nifty outperform on a relative basis if broader markets stabilize.
That said, rising volatility means positional trades should be backed by strict stop losses.
What This Means for Indian Market Participants
As India moves closer to the Union Budget, markets are likely to remain sensitive to:
- Institutional flows
- Global risk sentiment
- Volatility spikes
- Options-driven expiry dynamics
Retail traders should avoid over-leveraging and focus on level-based trading, while long-term investors may use volatility-driven corrections to stagger quality purchases under SEBI-compliant advisory guidance.
Why Traders Trust Swastika Investmart
In volatile market phases, reliable research and execution make a real difference.
Swastika Investmart, a SEBI-registered stock broker, offers:
- Deep technical and derivative research
- Daily market outlooks backed by data
- Robust trading platforms with fast execution
- Strong customer support and investor education initiatives
Whether you are an active trader or a long-term investor, structured insights help you stay aligned with market realities rather than emotions.
Frequently Asked Questions
Is the Indian stock market open on 20 January 2026?
Yes, NSE and BSE are open as per the regular trading calendar. Only US markets are closed due to a public holiday.
What does a rising India VIX indicate?
An increase in India VIX reflects higher expected volatility, often leading to sharper intraday price swings.
Why are FIIs selling while DIIs are buying?
FIIs react more to global cues and currency risks, while DIIs focus on domestic growth and long-term valuations.
Is Bank Nifty stronger than Nifty right now?
Technically, Bank Nifty shows a better structure with stronger support levels, though overall market sentiment remains cautious.
Conclusion: Trade the Levels, Respect the Volatility
The market set-up for 20 January 2026 suggests a volatile but range-driven session. With mixed global cues, cautious FII positioning, and key technical levels in play, discipline will be the biggest edge for traders today.
If you are looking to navigate such markets with confidence, expert-backed insights and reliable platforms matter.
👉 Open your trading account with Swastika Investmart today
Smart investing starts with informed decisions.
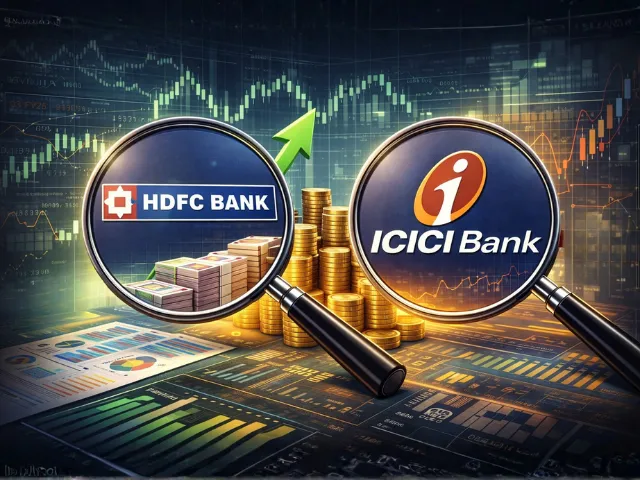
HDFC Bank & ICICI Bank Q3 FY26 Results: Key Highlights and Market Impact
Quick Snapshot
- HDFC Bank delivered steady profit growth backed by lower provisions and stable asset quality
- ICICI Bank saw a profit miss due to elevated provisions despite healthy loan growth
- Net interest margins for both banks remained largely stable in a tight liquidity environment
- Banking stocks reflected mixed market reactions, highlighting selective opportunities for investors
Introduction
The Q3 FY26 earnings season reaffirmed the resilience of India’s private sector banks, with HDFC Bank and ICICI Bank once again in the spotlight. While both banks reported stable asset quality and healthy business growth, differences in provisioning trends and profitability shaped market sentiment. For investors tracking banking sector stocks, these results provide useful cues on margins, risk management, and near-term growth visibility.
This blog breaks down the Q3 FY26 performance of HDFC Bank and ICICI Bank, explains what drove their numbers, and assesses the broader impact on Indian equity markets.
HDFC Bank Q3 FY26 Performance Overview
HDFC Bank reported a strong and balanced performance in Q3 FY26, underlining its consistent execution despite sector-wide margin pressures.
Earnings and Profitability
Net interest income rose 6.3 percent year on year to Rs 32,615 crore, supported by steady loan growth and disciplined pricing. Operating profit increased 8 percent year on year to Rs 27,098 crore, reflecting efficient cost management.
Net profit grew 11.5 percent year on year to Rs 18,654 crore, aided by a sharp decline in provisions. Provisions fell 18 percent quarter on quarter to Rs 2,838 crore, signalling stable credit costs.
Margins and Cost Factors
Core net interest margin stood at 3.35 percent. While margins remain lower than historical peaks, they have stabilised, indicating that the impact of higher funding costs may be largely priced in.
The bank also flagged an incremental impact of around Rs 800 crore due to the implementation of new labour codes, a factor investors will watch closely in coming quarters.
Asset Quality Snapshot
Asset quality remained steady. Gross NPA was flat at 1.24 percent quarter on quarter, while net NPA also stayed unchanged at 0.42 percent. This stability reinforces HDFC Bank’s reputation for conservative underwriting and robust risk controls.
ICICI Bank Q3 FY26 Performance Overview
ICICI Bank delivered healthy business growth but fell short of profit expectations due to higher provisioning.
Earnings and Profitability
Net interest income increased 7.7 percent year on year to Rs 21,932 crore, while net interest margin remained flat at 4.30 percent. Operating profit rose 3 percent year on year to Rs 17,356 crore.
However, net profit declined 4 percent year on year to Rs 11,318 crore, primarily because provisions jumped sharply to Rs 2,556 crore from Rs 914 crore in the previous quarter.
Asset Quality Trends
Despite higher provisions, asset quality improved marginally. Gross NPA declined to 1.53 percent from 1.58 percent quarter on quarter, and net NPA improved to 0.37 percent from 0.39 percent. This suggests the provisioning was largely precautionary rather than driven by fresh stress.
Advances and Deposit Growth
ICICI Bank continued to gain market share. Total advances rose 11.5 percent year on year to Rs 14.66 lakh crore, while deposits grew 9.2 percent year on year to Rs 16.59 lakh crore. This healthy balance sheet expansion supports long-term growth prospects.
HDFC Bank vs ICICI Bank: A Comparative View
From an investor’s lens, Q3 FY26 highlighted contrasting narratives. HDFC Bank stood out for profit consistency and lower credit costs, making it attractive for stability-focused portfolios. ICICI Bank, on the other hand, showcased stronger margins and loan growth but accepted higher provisions to strengthen its balance sheet.
A simple way to view this is like two businesses facing the same economic climate. One chooses steady expansion with tight risk control, while the other accelerates growth but builds extra buffers. Both approaches have merit depending on an investor’s risk appetite.
Market Impact and Investor Sentiment
The banking sector remains a key driver of Indian equity indices. HDFC Bank’s results supported sentiment around large-cap private banks, reinforcing their role as defensive compounders during uncertain macro conditions.
ICICI Bank’s profit miss led to short-term caution, but long-term investors may view higher provisions as a positive step toward sustainable growth. Overall, the results underline that stock selection within the banking sector is becoming more important than broad sector exposure.
From a regulatory perspective, stable asset quality aligns well with the Reserve Bank of India’s emphasis on prudent lending and adequate capital buffers.
What Should Investors Watch Next
Key monitorables for the coming quarters include trends in deposit costs, loan growth momentum, and the impact of regulatory changes such as labour codes on operating expenses. Investors should also track how banks balance growth with provisioning in a gradually normalising interest rate environment.
Frequently Asked Questions
How did HDFC Bank perform in Q3 FY26?
HDFC Bank reported double-digit profit growth driven by lower provisions and stable asset quality, with margins holding steady.
Why did ICICI Bank miss profit estimates?
The miss was largely due to elevated provisions, even though loan growth and asset quality remained healthy.
Are asset quality concerns rising in private banks?
No major concerns are visible. Both banks reported stable or improving NPAs, indicating controlled credit risk.
What is the market outlook for banking stocks after Q3 FY26 results?
The outlook remains selective. Banks with stable margins and disciplined risk management are likely to be preferred by investors.
Conclusion
The Q3 FY26 results of HDFC Bank and ICICI Bank highlight the underlying strength of India’s private banking sector, even as margin pressures and regulatory costs persist. For investors, the key takeaway is to focus on fundamentals, asset quality, and long-term execution rather than short-term earnings volatility.
For those looking to navigate banking stocks with confidence, Swastika Investmart offers SEBI-registered expertise, in-depth research tools, and strong investor support to help make informed decisions.
Ready to take the next step in your investment journey?
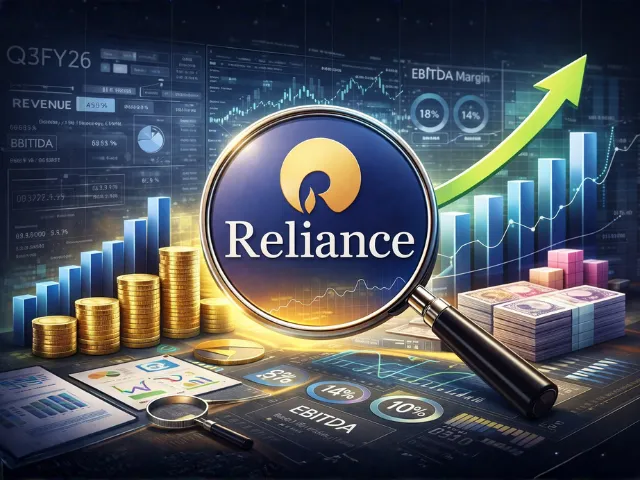
Reliance Q3FY26 Results Snapshot: Revenue, EBITDA and Margin Trends
Quick Snapshot
- Reliance Q3FY26 revenue grew 4 percent quarter-on-quarter
- EBITDA remained flat, leading to margin contraction
- O2C segment delivered strong growth, retail remained weak
- Net profit rose faster than EBITDA due to higher other income
- Net debt reduced marginally, supporting balance sheet stability
Reliance Q3FY26 Results Snapshot: Revenue, EBITDA and Margin Trends
Reliance Industries’ Q3FY26 consolidated results present a picture of steady topline growth but limited operating leverage. While revenue growth remained healthy, margin pressure, particularly in the retail business, prevented earnings from meeting market expectations.
The quarter highlights how different business segments contributed unevenly to overall performance, with strength in Oil-to-Chemicals partially offset by continued challenges in retail and oil and gas exploration.
Consolidated Q3FY26 Performance Overview
Reliance reported quarter-on-quarter revenue growth of 4 percent, with consolidated revenue rising to Rs 2,64,905 crore from Rs 2,54,623 crore.
Despite higher revenue, EBITDA remained largely flat at Rs 46,018 crore, compared to Rs 45,885 crore in the previous quarter. As a result, EBITDA margin declined to 17.4 percent from 18 percent, reflecting cost pressures and weak segmental performance in certain areas.
Net profit increased 2.6 percent to Rs 18,645 crore, supported by higher other income, which played a key role in cushioning operating weakness.
Why Earnings Missed Expectations
The earnings miss was primarily driven by weak retail performance, which weighed on consolidated margins despite stable revenue growth.
Retail continues to be a key driver of volume growth for Reliance, but profitability in this segment faced headwinds during the quarter due to structural and cyclical factors.
Segment-Wise EBITDA Performance
Oil-to-Chemicals Emerges as the Strongest Segment
The O2C segment reported a 10 percent quarter-on-quarter increase in EBITDA to Rs 16,507 crore, making it the standout performer in Q3FY26.
Growth in this segment was supported by:
- Better refining performance
- Benefit of a weaker Indian rupee
These positives were partly offset by weakness in the petrochemicals business, which limited further upside.
Retail Segment Remains the Biggest Drag
Retail EBITDA rose just 1 percent to Rs 6,915 crore, reflecting muted operating momentum.
More importantly, retail EBITDA margin declined to 7.06 percent, marking the lowest level in the last 13 quarters.
Several factors contributed to this pressure:
- High base effect, as the festive season last year was fully concentrated in Q3FY25
- In FY26, festive demand was split between Q2FY26 and Q3FY26
- Continued losses in JioMart Quick Commerce
- Impact of the demerger of Reliance Consumer Products
Together, these factors limited margin recovery despite stable revenues.
Oil and Gas Exploration Sees Decline
The oil and gas exploration segment reported a 3 percent decline in EBITDA to Rs 4,857 crore.
This was primarily due to:
- Lower realisation
- Decline in production volumes
The segment remains sensitive to operational and pricing dynamics, which impacted performance during the quarter.
Other Income Supports Bottom Line
One of the key reasons net profit growth outpaced EBITDA growth was a sharp rise in other income.
Other income increased 10 percent to Rs 4,914 crore, providing a meaningful boost to the bottom line and helping offset margin pressure at the operating level.
This underscores the role of non-operating income in supporting consolidated profitability during periods of operating stress.
Balance Sheet Update: Net Debt Improves
Reliance’s balance sheet showed modest improvement during Q3FY26.
Net debt declined to Rs 1,17,102 crore from Rs 1,18,545 crore on a quarter-on-quarter basis, reflecting disciplined financial management and stable cash generation.
Lower net debt strengthens financial flexibility and provides comfort amid mixed operating conditions.
What This Means for Investors
Reliance’s Q3FY26 results indicate that while topline growth remains intact, margin expansion is currently constrained by segment-specific challenges, especially in retail.
Key takeaways for investors include:
- O2C continues to provide earnings stability
- Retail margin recovery may take time
- Net profit resilience is supported by higher other income
- Balance sheet position remains steady
Given Reliance’s heavy weight in benchmark indices, its performance continues to influence broader market sentiment.
Frequently Asked Questions
Did Reliance Industries meet earnings expectations in Q3FY26?
Earnings missed expectations mainly due to weak retail performance and margin pressure.
Which segment contributed most to EBITDA growth?
The Oil-to-Chemicals segment was the strongest contributor, with EBITDA rising 10 percent.
Why did retail margins fall sharply?
High base effect, quick commerce losses, and the demerger of Reliance Consumer Products impacted retail profitability.
How did other income affect results?
Other income rose 10 percent and helped net profit grow faster than EBITDA.
Is Reliance’s debt position improving?
Yes, net debt declined marginally on a quarter-on-quarter basis.
Final Takeaway
Reliance’s Q3FY26 performance highlights the resilience of its diversified business model, even as margin pressure persists in certain segments. Strength in O2C and higher other income helped support overall profitability, while retail remains an area to watch closely.
For investors tracking large-cap earnings and sector trends, Swastika Investmart, a SEBI-registered brokerage, offers strong research capabilities, detailed earnings analysis, and responsive customer support to help navigate market decisions with confidence.
If you are planning your next investment move, you can begin here:

Wipro Q3FY26 Earnings Explained: What Worked, What Didn’t, and What Lies Ahead
Quick Snapshot
- Wipro’s Q3FY26 results missed estimates due to margin pressure and one-time costs
- Constant currency growth improved sequentially, signaling demand stabilisation
- Margins declined sharply due to labour code impact and restructuring costs
- Deal bookings fell sequentially, raising near-term growth concerns
- Management guidance indicates cautious optimism for Q4FY26
Wipro Q3FY26 Earnings Explained: What Worked, What Didn’t, and What Lies Ahead
Wipro’s Q3FY26 earnings reflect a familiar theme playing out across India’s IT sector: gradual demand recovery, but continued pressure on margins and deal momentum. While revenue growth showed improvement, profitability took a hit due to one-time costs linked to labour code implementation and restructuring initiatives.
For investors tracking large-cap IT stocks, Wipro’s quarterly performance offers important clues about how the sector is navigating global uncertainty, cautious client spending, and regulatory changes back home.
Q3FY26 Snapshot: Mixed Signals for Investors
At a headline level, Wipro reported sequential revenue growth, but earnings missed street expectations due to margin compression and lower-than-expected deal wins.
Revenue for the quarter rose 3.78 percent quarter-on-quarter to Rs 23,555.8 crore, marginally above estimates. However, operating performance weakened as EBIT declined 5.14 percent to Rs 3,491.4 crore, while net profit slipped 3.91 percent to Rs 3,119 crore.
This divergence between revenue growth and profit performance highlights the cost pressures facing IT companies in the current environment.
What Worked for Wipro in Q3FY26
Despite the headline miss, there were some encouraging trends beneath the surface.
Sequential Growth Improved
Wipro reported constant currency growth of 1.4 percent quarter-on-quarter, a notable improvement from 0.3 percent in the previous quarter. This suggests that client spending is stabilising after multiple quarters of muted demand.
For Indian IT companies, constant currency growth is a key indicator as it strips out currency fluctuations and reflects true business momentum.
Revenue Beat Estimates
Revenue came in slightly ahead of market expectations, reflecting steady execution across key verticals. While growth remains modest compared to historical cycles, it indicates resilience in Wipro’s diversified business model.
Guidance Indicates Stability
Management guided for Q4FY26 revenue growth in the range of 0 percent to 2 percent, an improvement over Q3’s guidance band of minus 0.5 percent to plus 1.5 percent. This suggests confidence in near-term order flows, even as macro uncertainty persists.
What Didn’t Work: Margin Pressure Takes Centre Stage
The biggest disappointment in Wipro’s Q3FY26 results was the sharp decline in margins.
EBIT Margin Falls Sharply
EBIT margin dropped 139 basis points to 14.82 percent, well below market expectations. The key reason was a one-time impact of Rs 565 crore related to labour code implementation and restructuring expenses.
India’s new labour codes are expected to improve long-term workforce efficiency and compliance, but the transition has created short-term cost pressure for IT firms with large employee bases.
Profitability Misses Estimates
Lower operating leverage and one-time costs led to a miss at the net profit level as well. For investors, this reinforces the view that margin recovery across the IT sector may be gradual rather than immediate.
Deal Wins and Bookings: A Cause for Caution
One area that raised concerns was total contract value bookings, which fell to $3.3 billion in Q3FY26 from $4.6 billion in Q2FY26.
Lower deal bookings can impact revenue visibility over the next few quarters, especially in an environment where clients are cautious about discretionary spending.
While deal pipelines remain healthy, conversion timelines appear stretched, a trend seen across the broader Indian IT services space.
Broader Market Context: What This Means for Indian IT Stocks
Wipro’s results mirror broader sector trends.
- Global clients continue to prioritise cost optimisation over large transformation deals
- Discretionary tech spending remains subdued
- Currency volatility adds another layer of complexity
- Regulatory changes like labour codes are creating short-term earnings pressure
For Indian equity markets, this suggests that IT stocks may remain range-bound until clearer signs of demand acceleration emerge.
What Lies Ahead for Wipro
Looking forward, Wipro’s performance will hinge on three key factors.
Margin Normalisation
As one-time labour code and restructuring costs fade, margins could stabilise, provided pricing pressure does not intensify further.
Deal Conversion
Improved deal execution and ramp-ups will be critical to sustaining revenue growth in FY27.
Global Macro Environment
Any easing in global interest rates or improvement in US and European tech spending could act as a positive trigger for the stock.
Frequently Asked Questions
Did Wipro meet earnings expectations in Q3FY26?
No, Wipro missed estimates at the profit level due to margin compression and one-time costs.
Why did Wipro’s margins fall sharply?
Margins declined mainly due to the one-time impact of labour code implementation and restructuring expenses.
Is Wipro’s revenue growth improving?
Yes, constant currency growth improved sequentially to 1.4 percent, indicating stabilising demand.
What does Wipro’s Q4FY26 guidance indicate?
The guidance of 0 percent to 2 percent growth suggests cautious optimism despite global uncertainty.
Should long-term investors worry about these results?
Long-term investors may view near-term weakness as part of a broader sector transition rather than a structural issue.
Final Takeaway: Cautious Optimism, Not Euphoria
Wipro’s Q3FY26 earnings underline a slow but steady recovery path for India’s IT sector. While revenue momentum is improving, margin pressure and softer deal bookings remain near-term challenges.
For investors seeking deeper insights into earnings trends, valuations, and sector outlooks, Swastika Investmart, a SEBI-registered brokerage, offers robust research tools, expert analysis, and responsive customer support to help make informed investment decisions.
If you are tracking IT stocks or planning your next investment move, you can get started here:
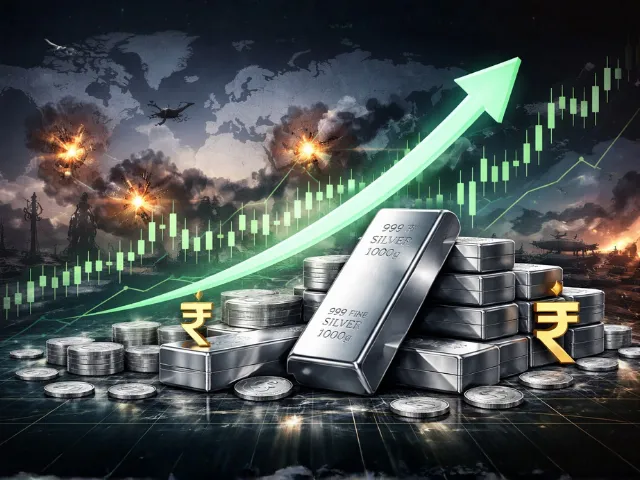
Geopolitical Tensions Push Silver Above ₹3 Lakh/kg: Is the Bull Run Just Beginning?
Quick Snapshot
- Silver prices have crossed ₹3 lakh per kg amid rising global geopolitical tensions
- Safe-haven demand and industrial usage are driving the current rally
- Indian investors are increasing exposure via ETFs, futures, and physical silver
- Volatility remains high due to global macro and currency movements
- Long-term outlook stays positive, but short-term corrections are possible
Geopolitical Tensions Push Silver Above ₹3 Lakh/kg: Is the Bull Run Just Beginning?
Silver prices in India have surged past the psychological mark of ₹3 lakh per kilogram, grabbing the attention of traders, investors, and even traditional jewellery buyers. The rally comes at a time when global uncertainty is intensifying, driven by geopolitical conflicts, supply chain disruptions, and fears of prolonged economic instability.
While gold usually steals the spotlight during uncertain times, silver has quietly emerged as a strong performer. The big question now is whether this rally has further legs or if prices are running ahead of fundamentals.
What Is Driving the Surge in Silver Prices?
Silver’s recent price movement is not a coincidence. Multiple global and domestic factors are working together to push prices higher.
Rising Geopolitical Uncertainty
Escalating tensions in key global regions have increased demand for safe-haven assets. Investors typically turn to precious metals when uncertainty clouds global growth and financial stability. While gold remains the primary hedge, silver often benefits alongside it due to its dual role as a precious and industrial metal.
Weakness in the US Dollar
A softer dollar makes commodities cheaper for non-US buyers, boosting demand. Since silver prices are globally benchmarked in dollars, any depreciation in the greenback tends to support prices in international and Indian markets.
Inflation and Interest Rate Concerns
Persistent inflation concerns and uncertainty around future interest rate trajectories have added to silver’s appeal. Even when interest rates remain elevated, investors often allocate to precious metals as a hedge against purchasing power erosion.
Industrial Demand Is Strengthening the Bull Case
Unlike gold, silver has extensive industrial applications, which adds a second layer of demand.
Key Sectors Driving Demand
- Solar panels and renewable energy infrastructure
- Electric vehicles and battery components
- Electronics and semiconductors
- Medical equipment and advanced technologies
India’s push toward renewable energy and electrification is structurally positive for silver demand. As the country expands solar capacity and EV adoption, silver consumption is expected to rise steadily.
Impact of Rising Silver Prices on Indian Markets
The rally in silver has had visible spillover effects across Indian financial markets.
Increased Retail Participation
Indian retail investors, traditionally inclined toward gold, are now showing renewed interest in silver. Many are using silver ETFs and commodity futures to gain exposure without holding physical metal.
Jewellery and Industrial Cost Pressures
Higher silver prices increase input costs for jewellery manufacturers and industrial users. While some costs are passed on, margins may come under pressure in the short term.
Commodity Market Volatility
Silver is known for sharper price swings compared to gold. This volatility attracts traders but also demands disciplined risk management.
Is Silver Overheated or Still Undervalued?
The move above ₹3 lakh per kg has sparked debates around valuation.
Why the Rally May Continue
- Strong geopolitical tailwinds
- Growing industrial and green energy demand
- Limited new supply additions globally
- Increasing investor allocation to alternative assets
Why Caution Is Needed
- Sharp rallies often invite profit booking
- Any easing in geopolitical tensions can cool prices
- Sudden currency appreciation can impact domestic prices
Historically, silver tends to outperform gold during late-stage commodity cycles but also corrects faster when sentiment turns.
How Can Indian Investors Participate in Silver?
Indian investors have multiple regulated avenues to invest in silver.
Physical Silver
Suitable for long-term holders, though storage and purity remain considerations.
Silver ETFs
SEBI-regulated silver ETFs offer transparency, liquidity, and ease of trading without physical handling.
Commodity Futures
Active traders can use MCX silver futures, but these require higher risk tolerance and margin discipline.
Each option suits different investment goals and risk profiles.
Risk Factors to Keep in Mind
- High price volatility compared to other asset classes
- Sensitivity to global macroeconomic signals
- Currency fluctuations affecting domestic prices
- Short-term corrections even within a long-term uptrend
Silver works best as part of a diversified portfolio rather than a standalone bet.
Frequently Asked Questions
Why have silver prices crossed ₹3 lakh per kg in India?
Rising geopolitical tensions, strong industrial demand, and a weaker dollar have driven prices higher.
Is silver a safer investment than gold?
Silver offers higher return potential but also comes with greater volatility compared to gold.
Can silver prices fall after such a sharp rally?
Yes, short-term corrections are common in silver, even during long-term bull phases.
How can retail investors invest in silver easily?
Silver ETFs provide a convenient and regulated way to invest without physical storage concerns.
Is silver suitable for conservative investors?
Silver may be better suited for investors with moderate to high risk tolerance.
Final Thoughts: Opportunity With Volatility
The move in silver beyond ₹3 lakh per kg reflects deeper global shifts rather than short-term speculation alone. While geopolitical risks and industrial demand provide strong support, silver’s journey is rarely smooth.
For investors seeking informed exposure to commodities, Swastika Investmart, a SEBI-registered brokerage, offers research-backed insights, advanced trading platforms, and strong customer support to help navigate volatile markets with confidence.
If you are considering investing in silver or diversifying your portfolio, you can get started here:

Shadowfax Technologies IPO Review: Should You Subscribe or Wait for Listing?
Quick Snapshot for Investors
- Shadowfax benefits from strong structural growth in India’s last-mile logistics ecosystem
- Revenue growth is accelerating, but profitability and margins remain weak
- IPO valuation at ~2.8x price-to-sales looks expensive versus Delhivery
- Heavy revenue dependence on Flipkart and Meesho increases business risk
- Best suited for high-risk, long-term investors; conservative investors may wait
Shadowfax Technologies IPO Review: High Growth Story, But Is the Valuation Comfortably Priced?
India’s e-commerce boom has reshaped how goods move across the country. From next-day deliveries to 10-minute grocery promises, last-mile logistics has become the backbone of digital consumption. Riding this powerful trend, Shadowfax Technologies’ IPO is drawing investor attention as another tech-enabled logistics player tapping public markets.
However, strong sectoral tailwinds do not always translate into comfortable investment returns. This IPO demands a closer look at growth quality, valuation comfort, and risk concentration before taking a call.
India’s Last-Mile Logistics Boom: The Big Tailwind
Shadowfax operates in one of the fastest-growing segments of India’s logistics ecosystem: last-mile and e-commerce delivery.
Key growth drivers include:
- Rapid expansion of e-commerce into Tier 2 and Tier 3 cities
- Rising adoption of quick commerce and D2C brands
- Consumer preference for faster and flexible deliveries
- Government reforms like GST that favour organised logistics players
As a technology-driven, asset-light platform, Shadowfax is well positioned to capitalise on these trends. Its delivery partner network and route optimisation tools allow it to scale quickly without heavy infrastructure investments.
This structural growth opportunity forms the core bull case for the IPO.
Revenue Momentum Is Strong, But Profitability Lags
Shadowfax has shown improving revenue momentum, driven by higher shipment volumes and deeper integration with large e-commerce platforms.
What the Numbers Suggest
- Consistent growth in topline revenue over recent years
- Increasing order density from key clients
- Expansion across multiple delivery categories
However, profitability remains a challenge.
Operating margins are thin due to:
- High rider acquisition and retention costs
- Incentives required to meet delivery timelines
- Technology and platform investment expenses
While losses have narrowed in phases, margin visibility is still evolving, making earnings predictability uncertain for investors focused on cash flows.
Valuation Check: Priced at a Premium?
At an estimated price-to-sales multiple of around 2.8x, the Shadowfax IPO appears expensively priced compared to listed peer Delhivery, which operates at a lower valuation multiple despite being larger and more diversified.
Why Valuation Matters Here
- Price-to-sales is a key metric for loss-making logistics companies
- A premium valuation assumes faster path to profitability
- Any slowdown in growth or margin improvement can trigger de-rating
Given that Shadowfax and Delhivery operate in similar segments, investors may question whether Shadowfax deserves a higher multiple without proven profitability.
This valuation gap makes downside risk more meaningful if execution falters.
Client Concentration: A Major Risk Factor
One of the most critical concerns in the Shadowfax IPO is revenue concentration.
A significant portion of the company’s revenue comes from just two clients:
- Flipkart, which is also an investor
- Meesho, a fast-growing but price-sensitive platform
Why This Is Risky
- Pricing power remains with large clients
- Contract renegotiations can impact margins sharply
- Any slowdown in these platforms directly affects revenue
Although Flipkart’s investor status adds strategic comfort, it also creates dependency risk. For public market investors, such concentration reduces business stability.
Who Should Consider This IPO?
Suitable For:
- High-risk investors with long-term investment horizons
- Investors bullish on India’s e-commerce and logistics growth
- Those comfortable with volatility and delayed profitability
Not Suitable For:
- Conservative investors seeking earnings visibility
- Income-focused investors
- Those sensitive to valuation risk
For many retail participants, waiting post-listing for better price discovery may be a more prudent approach, especially in volatile market conditions.
Broader Impact on Indian Equity Markets
Shadowfax’s IPO highlights an ongoing trend where new-age, platform-driven companies are testing public market appetite.
While such listings deepen India’s capital markets, they also require higher levels of investor scrutiny around governance, sustainability, and profitability timelines.
SEBI’s tightening disclosure norms have improved transparency, but valuation discipline remains crucial for retail investors.
Frequently Asked Questions
Is Shadowfax benefiting from India’s e-commerce growth?
Yes, the company is a direct beneficiary of rising online consumption and last-mile delivery demand.
Why is profitability still low?
High delivery partner costs, incentives, and expansion investments continue to weigh on margins.
Is Shadowfax IPO expensive compared to peers?
At around 2.8x price-to-sales, it is valued higher than listed peer Delhivery.
Does client concentration pose a serious risk?
Yes, heavy reliance on Flipkart and Meesho increases revenue and margin vulnerability.
Should conservative investors apply?
Conservative investors may consider waiting until post-listing performance stabilises.
Final Verdict: Growth Is Visible, But Risk Is Real
The Shadowfax Technologies IPO offers exposure to a powerful structural growth theme but comes with elevated valuation risk, profitability uncertainty, and client concentration concerns.
For investors who rely on deep research and disciplined analysis, Swastika Investmart, a SEBI-registered brokerage, provides detailed IPO insights, robust research tools, and strong customer support to help navigate such high-stakes opportunities.
If you’re planning to invest with clarity and confidence, consider opening your account today:


.webp)
.webp)

.webp)


START YOUR INVESTMENT JOURNEY
Get personalized advice from our experts
- Dedicated RM Support
- Smooth and Fast Trading App
