
NSDL Share Price Insights: Maharashtra NPS Parking And The CAG Findings


Key Takeaways
- A CAG audit found Rs 3,277.58 crore of Maharashtra NPS contributions parked in the Public Account instead of NSDL.
- The Public Account balance peaked at Rs 10,642.26 crore in 2020-21 and has declined since.
- In 2024-25, employee contributions were Rs 2,578.43 crore, with a Rs 222.97 crore shortfall in the government's 14% match.
- Total 2024-25 NPS contributions were Rs 5,843.20 crore; the Public Account received Rs 7,071.02 crore, including Rs 99.67 crore in accumulated interest.
Is pension money safe when public funds revolve around the Public Account rather than a market-linked instrument? A Comptroller and Auditor General audit reveals that Rs 3,277.58 crore in Maharashtra government employees' NPS contributions–and the state's 14% matching share–had not reached the NSDL trustee for investment as of 31 March 2025. This is more than a budgeting issue; it delays market-linked returns that subscribers expect from the Defined Contribution Pension Scheme. For retail investors, the phrase nsdl share price may surface when discussing how depository dynamics intersect pension flows and market pricing.
Understanding The Maharashtra NPS Parking Case And Its Investor Implications
At the heart of the matter is the National Pension System (NPS) architecture adopted by Maharashtra in October 2005 and rolled out as a Defined Contribution Pension Scheme for employees in August 2014. The system requires that 10% of basic pay and dearness allowance, contributed by employees, be matched by 14% from the government. When these contributions are collected, they are meant to move promptly to NSDL, the designated trustee, so they begin earning market-linked returns. Instead, the funds sat in Major Head 8342-117 of the Public Account, a temporary transit point that the government used for more than a decade, according to the audit. This is not merely a bookkeeping discrepancy; it undermines the integrity of the NPS architecture and potentially deprives subscribers of timely market-linked returns.
For 2024-25, the data shows employees contributed Rs 2,578.43 crore to their NPS accounts, while the government’s 14% matching contribution fell short by Rs 222.97 crore. In the same period, total contributions to the NPS were Rs 5,843.20 crore. Yet Rs 7,071.02 crore was transferred to the Public Account, which includes Rs 99.67 crore in accumulated interest and Rs 65.67 crore from employees on foreign service. The juxtaposition of these numbers highlights a gap between the flow of funds into a market-linked framework and the actual movement of money into NSDL for investment.
Healthily, the CAG’s report treats these findings as a compliance failure rather than a marginal misstep. It argues that the practice of parking contributions inside the Public Account delays investment and erodes subscriber returns. The Public Account’s balance related to this pension parking peaked in 2020-21 at Rs 10,642.26 crore and has declined since, but the persistence of such parking raises questions about governance, accountability, and the timeliness of funds being deployed into markets where they can earn returns for subscribers.
NSDL Share Price And Public Pension Funds: What Retail Investors Should Watch
NSDL–standing for National Securities Depository Limited–plays a pivotal role as the designated trustee for NPS assets. Although NSDL is a depository service provider and not a stock with a traditional share price, the health of the NSDL ecosystem matters for the flow of pension contributions into market-linked instruments. The issue here is not a stock price per se, but the reliability of infrastructure that can move employee and government contributions into NSDL depository accounts and then into market instruments. For investors, this matters because delays at NSDL or in depository services can reduce the time those funds spend earning market-linked returns. In practical terms, investors should consider how promptly pension contributions–once acknowledged by the NPS–are routed to the NSDL demat account and put to work in appropriate securities or funds.
Within this framework, it’s useful to understand how the nsdl demat account and nsdl depository services work in concert with pension flows. nsdl demat account refers to dematerialized holding accounts that hold securities electronically, while nsdl depository services provide the infrastructure to manage these holdings. When pension contributions are not transferred promptly, subscribers face delayed exposure to market performance. For a retail investor monitoring the broader impact of government accounting on market behavior, these delays can translate into measurable differences in cumulative returns over time. If you hold or anticipate exposure to NPS-linked investments, this is a reminder to assess the reliability of the underlying depository framework and the timeliness with which contributions are deployed into NSDL’s ecosystem.
As you evaluate your own exposure, remember that NSDL’s role aligns with the need for trustworthy, timely investment of pension contributions. While you won’t translate the exact nsdl share price into a personal pension return, you can think of the NSDL ecosystem as the plumbing that delivers market exposure. And if you want a practical, technology-led approach to evaluating stock- or index-level exposures around pension flows, consider Swastika's Sarthi AI stock assistant: Swastika's Sarthi AI stock assistant.
How The NPS Architecture Works And Why Timeliness Matters For Returns
The NPS is a Defined Contribution Pension Scheme designed to deliver market-linked returns over time. For Maharashtra, the structure means employee deductions equal 10% of basic pay and dearness allowance, with the government contributing a matching 14%. In practice, the combined 24% should flow from payroll to NSDL for immediate investment. The CAG notes that money has instead remained parked in the Public Account under Major Head 8342-117, which functions as a long-standing transit point rather than an investment channel. This delay can erode potential returns by exposing contributions to timing risk and market cycles that could have been captured earlier in NSDL’s investment process.
To understand the architecture, note that the pension funds are meant to be invested as soon as they are collected. The 2008 circular from the Ministry of Finance prohibits parking NPS contributions in thePublic Account, even temporarily. The Maharashtra case demonstrates a breach of this directive, and the audit frames it as a compliance issue with real consequences for subscribers’ returns. The effect is not hypothetical. When funds are not deployed promptly in NSDL, market-linked returns that could accrue to employees and subscribers are necessarily delayed or diminished. The CAG’s recommendation is explicit: transfer funds promptly to NSDL and close the shortfall in government contributions.
Key Figures From The CAG Audit On Maharashtra's Pension Contributions
Several numbers anchor this audit. Rs 3,277.58 crore is the sum of pension contributions deducted from employees plus the government’s matching 14% that had not yet reached NSDL for investment as of 31 March 2025. The balance in the Public Account for this purpose peaked at Rs 10,642.26 crore in 2020-21 and has declined since. For 2024-25, employee contributions totaled Rs 2,578.43 crore, with a shortfall in the government’s 14% contribution amounting to Rs 222.97 crore–a shortfall described as a separate compliance issue and resulting in an understatement of revenue expenditure by the same amount. Total NPS contributions for 2024-25 were Rs 5,843.20 crore. Of these, the government transferred Rs 7,071.02 crore to the Public Account, which includes Rs 99.67 crore in accumulated interest and Rs 65.67 crore from employees on foreign service.
The Maharashtra case also indicates the administrative boundaries of the NPS: the scheme applies to government service personnel since November 1, 2005, including aided schools and colleges, non-agricultural universities, Zilla Parishads, or Water Resources Department corporations. The state adopted the NPS architecture in October 2005 and formally rolled out the Defined Contribution Pension Scheme for these employees in August 2014, nine years after the cutoff date. The ongoing parking practice undermines the integrity of the NPS architecture and delays investment, potentially depriving subscribers of timely market-linked returns. The CAG’s recommendation is straightforward: ensure prompt transfer to NSDL and close the shortfall in the government's own contributions, with Major Head 8342-117 deprecated for such purposes.
Implications For Retail Investors: Market-Linked Returns And The Public Account
For a retail investor, the Maharashtra NPS parking issue underscores a broader principle: governance controls and timely fund deployment matter as much as the size of the contributions themselves. The NPS promises market-linked returns, but those returns hinge on timely movement of funds into NSDL and subsequent investment. Delays in transfer can translate into a drag on compounding that otherwise would have occurred in a timely manner. When the Public Account acts as a long-running parking lot, the opportunity cost to subscribers compounds across years, even if the ultimate investment outcome remains aligned with the Defined Contribution Pension Scheme framework.
Beyond the numbers, this case highlights the importance of ongoing oversight and transparency around pension flows. As investors, you should watch how government and employee contributions transition from payroll to NSDL and then into market exposures. You can monitor the integrity of these flows by looking for timely transfers, consistent accounting, and adherence to financial circulars designed to prevent parking. If you’re trying to build a mental model for assessing risk around pension-linked investments, imagine the flow in a pipeline: every day of delay is a day less of compounding at market rates, which matters when you plan for retirement milestones.
Policy Steps And Practical Remediation For Maharashtra
The CAG’s report offers a clear playbook for remediation. First, the state must ensure prompt transfer of both employee contributions and the government’s matching share to NSDL so that investments begin earning market-linked returns as soon as possible. Second, the shortfall in the government’s 14% contribution must be closed, reducing the understatement of revenue expenditure. Third, the state should eliminate the use of Major Head 8342-117 as a parking facility for NPS contributions, aligning with the 2008 Ministry of Finance directive that prohibits such parking even temporarily. Fourth, strengthen internal controls related to NPS flows and implement an auditable trail from deduction to NSDL investment to prevent future delays. Finally, institutional reforms should be considered to ensure the defined contribution pension system remains robust, transparent, and aligned with market opportunities for subscribers.
Frequently Asked Questions
What did the CAG find about Maharashtra's NPS contributions?
The audit found Rs 3,277.58 crore in pension contributions deducted from employees, plus the state's 14% matching share, had not reached the NSDL trustee for investment as of 31 March 2025.
What is Major Head 8342-117 and why is it significant?
Major Head 8342-117 is the Public Account head where NPS contributions were parked as a transit point, delaying investment into NSDL and market-linked returns.
What role does NSDL play in the NPS?
NSDL stands for National Securities Depository Limited and is the designated trustee for NPS investments; funds are meant to be transferred to NSDL for market-based investment.
What were the 2024-25 NPS contribution figures in Maharashtra?
Employee contributions were Rs 2,578.43 crore; the government’s 14% matching share fell short by Rs 222.97 crore; total NPS contributions were Rs 5,843.20 crore, with Rs 7,071.02 crore transferred to the Public Account (including Rs 99.67 crore in accumulated interest and Rs 65.67 crore from employees on foreign service).
What remediation did the CAG propose for Maharashtra?
The CAG recommended prompt transfer of funds to NSDL, closing the government’s shortfall, and ending parking in Major Head 8342-117, along with strengthening controls to prevent future delays.
Conclusion
In the near term, the recommended policy actions–prompt NSDL transfer, closing the shortfall, and ending parking in Major Head 8342-117–could restore the expected market-linked returns for subscribers and reinforce trust in the NPS framework. As an investor, your takeaway should be to monitor pension flow governance and to seek investments that are supported by robust depository infrastructure and timely fund deployment. This combination–clear governance, timely investment, and access to AI-assisted stock research–helps bridge the gap between pension promises and realized retirement outcomes.
Open your trading and demat account here
Reference :
1 : Ndtvprofit
Latest Articles

Gift Nifty Price Signals A Positive Start: Global Cues Lift Indian Markets


Key Takeaways
- gift nifty price signals a positive open as global cues turn supportive.
- sensex level today climbs to 76,741.82 and nifty index level today to 23,962.80.
- US indices rally with Dow Jones up 0.27%, S&P 500 up 0.81%, Nasdaq up 1.30%; Brent crude price around $76.23 and WTI around $71.91.
- gold price today holds near $4,122 as macro data and commodity moves guide near-term momentum; watch crude oil price movements and jobless claims data.
gift nifty price signals a positive open as global cues turn supportive. Gift Nifty was trading near the 24,104 mark, about 105 points above the previous close of nifty futures price, signaling a firm opening for domestic stocks. The sensex level today stood at 76,741.82 and the nifty index level today reached 23,962.80, painting a picture of cautious optimism among traders. Across Asia and the U.S., major indices advanced, with Dow Jones up 0.27%, S&P 500 up 0.81%, and Nasdaq rising 1.30%.
Investors are parsing a blend of macro signals and commodity moves as the week unfolds. The Brent crude price traded around $76.23 per barrel and the U.S. WTI price hovered near $71.91 per barrel, underscoring that energy markets remain a key driver of risk appetite. In precious metals, the gold price today held near $4,122 per ounce, adding another layer of context for risk-off or risk-on tilts depending on the evolving macro backdrop.
Fresh data on the labor market added to the attention. Initial U.S. jobless claims declined to 215,000 for the week ended July 4, below the 218,000 consensus, signaling cooling but still resilient labor conditions. In Japan, producer prices rose 7.1% year-on-year in June, beating forecasts and suggesting that inflation dynamics remain a global focal point for traders who are weighing whether global growth can maintain its current momentum.
Global Developments To Guide Market Sentiment
Investors continue to weigh the political climate, commodity price action, and foreign equity performance as a trifecta that will guide short-term market trends. With Gift Nifty suggesting a positive start and global markets exhibiting strength, focus may be expected to stay on foreign inputs, crude oil price movement and general macroeconomic conditions throughout the course of trade. The synthesis of these factors will determine whether domestic indices can extend gains or encounter resistance as liquidity conditions evolve.
Gift Nifty Price Signals A Positive Open: Reading The Open And What It Means For Your Portfolio
The Gift Nifty price update suggests that Indian equities are poised for a constructive session. A positive open often acts as a prelude to intraday momentum, particularly when global peers show strength. For retail investors, this means there could be an entry point to observe how early breadth develops across sectors such as financials, energy, and consumer goods. The immediate action for many is to validate risk controls and set guardrails rather than chase every uptick. If the session opens with capital inflows and steady participation, you may see select mid- and small-cap segments catching up to the larger index peers.
From a practical standpoint, the market’s initial tilt often provides clues about sector rotation. Energy, materials, and financials may respond to global cues and commodity price shifts, while technology and consumer staples could offer steadier performance as traders assess growth versus value dynamics. As you monitor the trade flow, consider how your current allocations align with your risk tolerance and time horizon. And for deeper stock-level insights, Swastika's Sarthi AI stock assistant can help you analyze stocks and indices with institutional-grade research. Swastika's Sarthi AI stock assistant is a practical tool to augment your decision-making during such momentum-driven mornings.
Sensex Level Today And Nifty Index Level: Reading The Market Pulse
The market’s intraday cadence is often reflected in the sensex level today and the nifty index level today. In the latest session, the Sensex advanced 238.22 points, or 0.31%, to close at 76,741.82, while the Nifty 50 finished higher by 80.75 points, or 0.34%, at 23,962.80. These readings indicate a constructive mood that may sustain if foreign inputs remain supportive and macro data continues to align with expectations. Investors should watch how this momentum translates into sector rotation and whether breadth remains broad across large- and mid-cap segments.
While a positive close provides a cushion, it’s important to recognize that intraday volatility can surface as traders reposition in response to evolving global cues. A disciplined approach–focusing on risk management, stop placement, and a clear exit plan–helps convert initial momentum into more durable gains. The market environment requires patience; reactions to news flow can drive swings that test positions built on the opening prints.
Global Markets In Focus: How U.S. Indices And Commodities Shape Indian Momentum
Global momentum provides the backdrop for the day’s domestic action. The Dow Jones Industrial Average gained 0.27%, the S&P 500 rose 0.81%, and the Nasdaq Composite advanced 1.30%. Such breadth in U.S. indices often correlates with risk appetite and can influence how Indian traders price growth and inflation expectations. In parallel, commodity markets are guiding risk sentiment. Brent crude price hovered around $76.23 per barrel, while WTI crude traded near $71.91 per barrel. These levels keep energy companies and consumer-facing sectors sensitive to price moves, which in turn impacts earnings expectations across domestic equities.
Macro data released globally add another layer of context. The initial U.S. jobless claims at 215,000 for the week ended July 4 surprised to the downside, suggesting ongoing resilience in the labor market. In addition, Japan’s producer prices rose 7.1% year-on-year in June, underscoring persistent inflationary pressure in major economies. For Indian investors, these global dynamics imply that foreign inputs, currency stability, and risk sentiment will continue to shape near-term momentum.
Gold Price Today And Crude Oil Price Movements: Near-Term Signals For Traders
The commodity backdrop remains a critical driver for near-term activity. The gold price today stood around the $4,122 per ounce mark, contributing to a broader inflation-hedge narrative that can support risk-off hedging during moments of uncertainty. On the energy front, the crude oil price environment remains a focal point: Brent crude price near $76.23 and WTI around $71.91 keep oil-sensitive sectors in focus and create a framework for corporate earnings in energy and industrials. For traders, this means monitoring how hedging costs, supply-demand balances, and geopolitical headlines influence commodity trajectories, as these factors often feed into forward-looking earnings expectations and stock-specific moves.
Within this context, investors should recognize that position sizing matters more than chasing every price tick. A measured approach–establishing clear risk-reward parameters and aligning exposure with your investment horizon–helps protect capital as markets digest global cues and domestic data prints. Being mindful of the relationship between commodity moves and macro data can prevent overreacting to short-term volatility, while still allowing you to participate in upside moves when the market confirms a durable uptrend.
Strategies For Retail Investors In The Gift Nifty Price Era: Risk Management And Diversification
As Gift Nifty price signals a positive start, retail investors should prioritize risk management and diversification to navigate the current mix of global cues and domestic momentum. A practical step is to keep a balanced exposure across equities, fixed income, and cash to weather potential whipsaws. For stock-level ideas, you might notice a number of trading opportunities across sectors that could benefit from the ongoing macro narrative; however, it’s essential to corroborate any idea with fundamentals and price action rather than relying solely on momentum.
In addition to a diversified approach, investors should consider focusing on high-quality names with resilient earnings and robust cash flows. The current environment–characterized by global inflation dynamics and commodity price sensitivity–often rewards companies with strong balance sheets and pricing power. For those scanning for opportunities, you may encounter a candidate mentioned in market discussions as a possible 5paisa stock to buy today, but treat such leads as starting points for further due diligence rather than immediate action. Remember to use tools like Swastika's Sarthi AI stock assistant for institutional-level research on any stock or index to retail investors; it can help you validate ideas, quantify risk, and tailor your plan to your financial goals.
Related Reads
Frequently Asked Questions
What does the Gift Nifty price indicate about the market open today?
Gift Nifty price near 24,104 indicates a positive opening for Indian equities as global cues turn supportive, suggesting room for a constructive start in domestic indices.
How did the Sensex and Nifty perform in the latest session?
The Sensex rose to 76,741.82, up 238.22 points or 0.31%, while the Nifty 50 settled at 23,962.80, up 80.75 points or 0.34%.
Which U.S. indices showed strength and what were the commodity moves?
Dow Jones gained 0.27%, S&P 500 rose 0.81%, and Nasdaq climbed 1.30%, while Brent crude price traded around $76.23 per barrel and WTI near $71.91 per barrel.
What is the current gold price today and crude oil price movements to watch?
The gold price today held near $4,122 per ounce, and the crude oil price movements remain in focus with Brent around $76.23 and WTI around $71.91 per barrel.
Where can I find deeper stock research and insights?
For institutional-level research tools that empower retail investors, explore Swastika's Sarthi AI stock assistant at Swastika's Sarthi AI stock assistant.
Conclusion
The Gift Nifty price setup is a reminder that a positive opening–driven by global cues and macro momentum–does not guarantee a smooth ride for every stock. Retail investors should translate the early signal into a disciplined plan: confirm market breadth, manage risk with clear stop-loss levels, and stay aligned with your time horizon. When the opening momentum aligns with solid fundamentals and favorable macro trends, you gain probability in your favor; if not, you have a framework to exit gracefully rather than chase a move that reverses quickly.
Open your trading and demat account here
Reference :
1 : 5Paisa

RBI Currency In Circulation Update: June 30, 2026 Data And What It Means For Retail Investors
Key Takeaways
- RBI currency in circulation stood at Rs 42.94 lakh crore as of June 30, 2026.
- Fortnightly change in currency in circulation fell 0.50% while reserve money rose 0.30% to Rs 52.56 lakh crore.
- Currency in circulation grew 12.4% year-on-year, up from 7.3% a year ago.
- In the fiscal year to date, currency in circulation rose 3.1% and reserve money 2.9%.
What happens when money in circulation shifts quietly? A single data point might reshape liquidity expectations, policy timing, and your investment approach. RBI currency in circulation data for June 30, 2026 shows Rs 42.94 lakh crore in active circulation, marking a 3.1% gain for the fiscal year to date. The fortnightly change in currency in circulation fell 0.50%, while reserve money ticked up 0.30% to Rs 52.56 lakh crore. For retail investors, this snapshot is a key thermometer of liquidity and potential market impulses. For investors, tracking rbi currency in circulation is an essential barometer of liquidity and policy signaling. The variables interact with bank credit, domestic demand, and global liquidity conditions, shaping the trading tone across equities, bonds, and money markets.
To give readers a quick snapshot, the table below consolidates the key RBI currency in circulation figures for June 30, 2026. The numbers are RBI data points, which investors often use as a fundament for short- to mid-term liquidity expectations. The gap between currency in circulation and reserve money highlights the portion of liquidity that banks hold as reserves in addition to the currency circulating outside the central bank. In practice, this gap (reserve money minus currency in circulation) reflects the reserves banks hold with the central bank, which can influence money market rates and debt yields in the near term.
| Metric | Value | Fortnightly Change |
|---|---|---|
| Currency In Circulation (June 30, 2026) | Rs 42.94 lakh crore | -0.50% |
| Reserve Money (June 30, 2026) | Rs 52.56 lakh crore | +0.30% |
| Currency In Circulation YoY | 12.4% | – |
| YoY Change Last Year | 7.3% upmove | – |
| FYTD Currency In Circulation | 3.1% | – |
| FYTD Reserve Money | 2.9% | – |
For readers evaluating liquidity conditions, the data also illustrates how rbi money supply – a broader gauge that includes currency in circulation and bank reserves – interacts with the measured currency in circulation. The latest figures imply a continuity of gradual expansion in broad money, consistent with a liquidity environment that supports ongoing investment activity without overheating. As markets weigh policy expectations and growth signals, practitioners should monitor monthly changes in currency in circulation alongside reserve money to gauge the tempo of liquidity shifts. If you want deeper stock-specific analysis, Swastika offers a powerful tool: Swastika's Sarthi AI stock assistant for institutional-grade research on any stock or index to retail investors.
Rbi Currency In Circulation Update: June 30, 2026 Data And What It Means For Investors
At the headline level, the RBI currency in circulation figure on June 30, 2026 is Rs 42.94 lakh crore. This number is the sum of cash held by the public and currency that circulates outside the Reserve Bank of India. The year-on-year growth rate of 12.4% signals substantial expansion in cash in public hands compared with the prior year. The 7.3% upmove recorded at the same time last year provides a benchmark for evaluating whether current liquidity growth is accelerating or normalizing as the economy evolves. For investors, a higher currency in circulation often accompanies stronger demand optimism in nominal terms, occasional pressures on short-end yields, and a nuanced effect on credit uptake by households and businesses. However, liquidity dynamics are multifaceted, and currency in circulation is only one piece of the puzzle.
The fortnightly movement – a decrease of 0.50% – indicates a carbon copy of a momentary demand-supply gap in the currency market. A modest decline like this can stem from factors such as banks adjusting currency holdings, remittance flows, and the seasonality of cash usage. It is important to view this as part of a broader cycle rather than a standalone signal. In the same frame, reserve money rose by 0.30% to Rs 52.56 lakh crore, underscoring that the monetary base narrowed the gap toward a more balanced liquidity footprint. In practice, reserve money growth can cushion or amplify price signals, depending on where the currency is circulating and how banks monetize reserves.
Reserve Money Vs Currency In Circulation: A Clearer Picture For Retail Investors
To interpret the RBI currency in circulation data properly, it helps to distinguish between currency in circulation and reserve money. Currency in circulation refers to the cash held by the public and circulating outside the RBI. Reserve money, on the other hand, includes currency circulating in the economy plus the deposits that banks hold with the central bank and other components of the monetary base. The June 30, 2026 snapshot shows Rs 42.94 lakh crore in currency in circulation and Rs 52.56 lakh crore in reserve money, illustrating that reserve money exceeds currency in circulation by roughly Rs 9.62 lakh crore. This gap is the financial foundation for bank reserves, and it interacts with short-term rate dynamics, money market liquidity, and the pass-through to lending conditions. For a retail investor, this distinction matters because it clarifies where liquidity is being held and how policy moves could influence short-term financial conditions.
From a practical trading standpoint, the relationship suggests that even with robust currency in circulation growth, the central bank may target reserve money levels to manage liquidity and policy rates. The 0.30% fortnightly rise in reserve money signals a cautious expansion in the base that can support market functioning without fanning excessive spillovers into risk assets. The RBI currency in circulation data, in combination with reserve money movements, forms a core part of the macro backdrop that shapes earnings, commodity prices, and interest-rate expectations. This is a lens through which investors should view instrument choices across equities, rates, and currency markets. In this context, ongoing monitoring of rbi updates and the evolving rbi money supply numbers can help investors calibrate entry and exit points with greater confidence.
Fortnightly Changes In Currency In Circulation And Market Liquidity
The 0.50% decline in the fortnightly currency in circulation points to a temporary tightening in cash with the public. While this may appear modest, it matters for day-to-day liquidity, particularly in segments such as overnight money markets and short-duration bonds. In periods of modest declines in currency in circulation, market participants may observe a subtle uptick in liquidity preference by banks, which can influence short-term funding costs. The take-home for traders and investors is to watch how this pace interacts with bank credit flows and consumer spending momentum over the next few weeks. When currency in circulation rises again, it could signal a softening in liquidity demand from the public or an expansion in cash usage for transactions as the calendar turns toward the festive or harvest seasons. The RBI data point remains a key input for forecasting near-term liquidity trends and assessing the risk premium embedded in short-term debt instruments.
Year-On-Year Growth In Currency In Circulation And Its Economic Implications
The 12.4% year-on-year growth in currency in circulation stands out as a robust indicator, reflecting a larger cash footprint in the economy compared with the prior year. This level of YoY expansion can be influenced by a range of factors, including consumer demand, cash usage in transactions, remittance flows, and the pace of digitization. While a high YoY growth in currency in circulation hints at strong cash usage, the interpretation must be balanced against other macro metrics such as inflation, consumer credit, and the evolution of non-cash payment adoption. For investors, a higher currency in circulation can signal a supportive nominal environment for consumption-oriented sectors and services, but it can also signal pressure on real yields if inflation rises alongside cash in hand.
Practical Takeaways For Investors From The June 2026 RBI Data
For retail investors, the June 30, 2026 RBI currency in circulation numbers offer several practical implications. First, the sustained YoY growth in currency in circulation at 12.4% indicates a cash footprint that remains meaningful, even as digital payments expand. This environment can support consumer-facing sectors and services with a cash-intensive transaction mix, particularly in regions where cash usage still plays a central role. Second, the modest fortnightly decline in currency in circulation (-0.50%) paired with a positive reserve money trajectory (+0.30%) suggests that while cash in hands fluctuates, the monetary base is being maintained to support liquidity. This combination tends to keep short-term financial conditions relatively stable, reducing the likelihood of abrupt liquidity squeezes that could spike volatility in risk assets.
Third, the gap between reserve money and currency in circulation highlights the portion of liquidity banks hold with the RBI, which influences money market yields and the availability of funds for short-term credit. Investors should watch how this balance evolves, especially in the lead-up to policy decisions or when macro shocks occur. A stable or gradually expanding reserve money environment can support a softening of near-term yield curves and provide a supportive backdrop for income-oriented investments while equity valuations are aligned with earnings momentum. Fourth, the fiscal-year-to-date figures–currency in circulation up 3.1% and reserve money up 2.9%–suggest a moderate expansion in liquidity through the year, which may support ongoing consumer spending and corporate investment activity. For risk management, this means maintaining diversification across asset classes while staying alert to shifts in liquidity regimes that could accompany policy shifts or inflation surprises.
Frequently Asked Questions
What is the latest RBI currency in circulation as of June 30, 2026?
Rs 42.94 lakh crore.
What was the fortnightly change in currency in circulation?
It fell 0.50%.
What is the total reserve money as of June 30, 2026?
Rs 52.56 lakh crore, with a fort- nighty change of 0.30%.
What is the year-on-year growth in currency in circulation?
12.4%.
How much currency in circulation gained in the current fiscal year to date?
3.1%.
How much reserve money added in the current fiscal year to date?
2.9%.
Conclusion
For the retail investor, the latest RBI currency in circulation data signals that liquidity conditions remain orderly with a broad base of monetary support, even as cash in circulation grows faster year-on-year. The 3.1% FYTD rise in currency in circulation alongside a 2.9% FYTD rise in reserve money points to a measured expansion in the liquidity framework rather than a sudden liquidity deluge. The takeaway is clear: maintain a balanced portfolio, monitor monthly RBI currency in circulation and reserve money data, and be prepared for policy signals that could alter liquidity dynamics in the quarters ahead.
Open your trading and demat account here
Reference :

Goldiam International Share Price: Bonus Issue And Q4 Results
Key Takeaways
- The goldiam international share price swung on ex-bonus day with a ~24% decline due to the 1:3 bonus adjustment.
- The company announced a 1:3 bonus issue, with nearly 4 crore shares and Rs 2 face value; record date is July 10 and credits by July 25.
- Q4 FY26 delivered consolidated net profit of Rs 37 crore on Rs 235 crore revenue, with 61% profit growth and 18% revenue growth year over year.
- Longer-term, the stock is up about 17% in 2026, with 22% returns over one year and 227% over three years; market cap stands near Rs 4,784 crore.
The goldiam international share price swung wildly on the ex-bonus day as the 1:3 bonus issue was factored in. The decline, about 24% in a single session, was purely an adjustment due to the bonus shares and not a reflection of the company’s fundamentals. The stock opened at Rs 321.5 apiece on the NSE on Friday, while Thursday's closing price stood at Rs 420.50 apiece. After adjusting for the bonus, the price gained more than 3% to trade at around Rs 325 apiece, seen at 10:15 AM. This event highlights how bonus adjustments can create short-term distortions in price even as the underlying business story remains intact.
Goldiam International Share Price Movements After Ex-Bonus And 1:3 Split
Following the ex-bonus day, the goldiam international share price reflected the adjustment mechanics rather than a change in fundamentals. The immediate reaction was a sharp intraday fall, but the post-adjustment path showed resilience as investors digested the bonus structure and the implications for the equity base. The price path in the immediate aftermath serves as a practical reminder for retail investors to separate technical shocks from long-run value signals when evaluating a listing with a bonus issue in the mix.
Goldiam International Bonus Issue Details: Record Date, Credit Date, And Share Allotment
The board approved a 1:3 bonus issue – one bonus share of Rs 2 face value for every three shares held as of the record date. The company will issue nearly 4 crore shares, amounting to Rs 7.53 crore as part of the bonus issue. The capitalization will be funded through capital redemption reserves (Rs 5.67 crore), securities premium account (Rs 196 crore), and free reserves (Rs 311 crore); retained earnings available as of March 31, 2026, also form part of the balance sheet considerations. Bonus shares will be credited by July 25 this year. Notably, this is the first bonus issue announced by the diamond jewellery maker in around 21 years, according to Trendlyne's reference data. The record date is fixed on July 10, and investors taking fresh positions today will not be eligible to receive the bonus shares.
| Event | Detail |
|---|---|
| Bonus Ratio | 1:3 (one bonus for every three shares) |
| Face Value Of Bonus Shares | Rs 2 per share |
| New Shares Issued | Nearly 4 crore shares |
| Total Value Of Bonus Shares | Rs 7.53 crore |
| Record Date | July 10 |
| Credit Date | By July 25 |
| Funding Sources | CRR Rs 5.67 crore; Securities premium Rs 196 crore; Free reserves Rs 311 crore; Retained earnings (as of Mar 31, 2026) |
| Notes | First bonus issue in about 21 years (Trendlyne) |
Goldiam International Quarterly Results: Q4 FY26 Profit, Revenue, And YoY Growth
Goldiam International reported Q4 FY26 consolidated net profit of Rs 37 crore for the January-March quarter, with year-over-year net profit growth of 61% from Rs 23 crore in the corresponding quarter of the previous financial year. Revenue from operations stood at Rs 235 crore during the quarter, marking a YoY revenue growth of over 18%. The company stated that it delivered a superior performance in FY26 despite US tariffs and volatile gold prices, underscoring resilience in its export and domestic markets.
Market Cap, Returns, And Long-Term Trends For Goldiam International Share Price
The market capitalization sits near Rs 4,784 crore, reflecting a mid-cap diamond jewellery maker with a diversified footprint. The stock is up around 17% in 2026 so far, driven by the bonus issue and a healthy quarterly run rate. Looking longer term, investors would be rewarded with a 22% return over one year and an impressive 227% over three years, indicating meaningful equity growth for those who held through the volatility. The near-term ex-bonus action should be weighed against these longer-run fundamentals when evaluating the trajectory of the goldiam international share price.
What Retail Investors Should Do Next: Practical Outlook And Tools
Retail investors should distinguish between the noise of ex-bonus price movements and the underlying value story. The bonus issue expands the equity base, which could influence earnings per share and potential dividend capacity in the near term, even as Q4 FY26 results point to robust profitability. The record date (July 10) and the credit date (by July 25) are critical for eligibility considerations. For more precise stock-by-stock analysis and to benchmark strategies across sectors, consider using Swastika's Sarthi AI stock assistant – Swastika's Sarthi AI stock assistant.
Frequently Asked Questions
What caused the goldiam international share price to crash after ex-bonus?
The decline of about 24% in a single day was purely due to the 1:3 bonus share adjustment and not a reflection of business fundamentals.
When is the record date for the goldiam international bonus issue?
The record date for the 1:3 bonus issue is July 10.
How many bonus shares will be issued and what is the face value?
Nearly 4 crore bonus shares will be issued, with a face value of Rs 2 per share, on a 1:3 basis (one bonus for every three shares held).
When will the bonus shares be credited to shareholders?
Bonus shares are expected to be credited by July 25 this year.
What were Goldiam International quarterly results for Q4 FY26?
Q4 FY26 consolidated net profit was Rs 37 crore, with revenue from operations of Rs 235 crore. YoY profit growth was 61%, and revenue growth was over 18%.
Conclusion
For retail investors today, the immediate takeaway is to separate the ex-bonus price reaction from the longer-term fundamentals. The 1:3 bonus issue expands the equity base and could influence near-term EPS, while Q4 FY26 results reinforce resilience in earnings and revenue. The goldiam international share price trajectory around the bonus event is a reminder that short-term moves can diverge from longer-term growth, and patient readers could benefit from focusing on the company’s underlying profitability and return profile rather than on day-to-day fluctuations.
Open your trading and demat account here
Reference :
1 : Economictimes

TCS Share Price Sparks IT Rally: What It Means For Retail Investors
Key Takeaways
- tcs share price surged after a stronger-than-expected Q1, signaling AI-led upside for the IT rally.
- Infosys stock price rose 4% to Rs 1,091; hcl tech stock price rose to Rs 1,192; mahindra tech stock price rose to Rs 1,478; stock price of wipro rose over 2% to Rs 177.
- Nifty IT index jumped 3.5% to 28,439.55, lifting midcaps like Coforge, persistent systems stock, Oracle Financial Services, and l&t technology services stock up to 3%.
- Brokerages turned positive, with Nuvama seeing 46% upside, MOFSL targeting Rs 2,350 (about 15%), and Dolat Capital at Rs 2,580 (around 26%), driven by AI-led opportunities and margin resilience.
tcs share price moved decisively after a stronger-than-expected Q1 print, fueling a broader IT rally across major peers. infosys stock price rose 4% to Rs 1,091; hcl tech stock price gained around 4% to Rs 1,192; mahindra tech stock price rose around 4% to Rs 1,478; stock price of wipro added over 2% to Rs 177. The day’s Nifty IT index moved up 968 points, or 3.5%, to 28,439.55 as investors priced in AI-led opportunities and resilient margins.
At the heart of the rebound is resilience in margins even as wage costs begin to bite, and an ongoing belief that AI-enabled services can unlock new deal volumes. TCS’s Q1 beat reinforces a narrative of select pockets of growth in a sector facing macro headwinds, with investors focusing on deal wins, pricing power in high-value segments, and the ability to scale AI-enabled offerings.
Brokerage optimism followed the headline numbers, with Nuvama projecting a 46% upside for TCS based on margin stability and sustained deal flow. Motilal Oswal Financial Services (MOFSL) continues to rate the stock as Buy, with a target price of Rs 2,350, implying a potential upside of around 15%. Dolat Capital has upgraded TCS to Buy, with a higher target of Rs 2,580, valuing the stock at about 16x FY28E earnings of Rs 161.5.
Analysts note that although management expects demand to improve in 2Q, growth is likely to come from select pockets rather than broad-based acceleration. In the near term, AI-led opportunities, partnerships, and continued investments in sales appear key to sustaining earnings momentum, even as discretionary spending and wage costs pose ongoing challenges.
To help readers visualize the move, here is a snapshot of the day’s stock moves: the TCS share price advanced to Rs 2,118 (up 3.5%), Infosys stock price rose to Rs 1,091 (up 4%), the hcl tech stock price touched Rs 1,192 (up around 4%), and the mahindra tech stock price climbed to Rs 1,478 (up around 4%). The stock price of wipro rose to Rs 177 (up over 2%). The Nifty IT index reached 28,439.55, a 3.5% gain, while midcap IT names Coforge, persistent systems stock, Oracle Financial Services, and l&t technology services stock rose as much as 3%.
For investors seeking deeper, stock-specific insights, Swastika’s Sarthi AI stock assistant can help tailor ideas to your risk profile. Swastika's Sarthi AI stock assistant serves as a bridge between the day’s headlines and a practical, research-backed plan for your portfolio.
TCS Share Price And Q1 Outlook: Margin Resilience And AI Upside
The Q1 FY27 print from TCS beat expectations on the top line and showed margin resilience despite wage hikes. Management indicated that margin pressure was felt sequentially as wage costs took effect, yet the company continued to win deals and invest in high-growth AI-enabled services. The implication for the broader IT space is that AI-led demand can help offset some of the margin headwinds from wage growth, supporting a constructive view on the sector.
Analysts highlight that while near-term demand improvement is anticipated in 2Q, growth will be selective. The 1QFY27 commentary is viewed as better than expected, reinforcing a view that AI capabilities, partnerships, and a disciplined focus on profitable growth can drive sustained earnings momentum for TCS and its peers.
Brokerage commentary reflects an upbeat stance on valuations and potential upside. Nuvama projects a 46% upside, underpinned by margin delivery and ongoing deal wins. MOFSL maintains a Buy rating with a target of Rs 2,350, implying about 15% upside. Dolat Capital upgrades the stock to Buy with a target price of Rs 2,580, suggesting roughly 26% upside. All three views acknowledge AI-led opportunities as a key growth lever even as macro uncertainty lingers.
From an investor’s perspective, the takeaway is clear: the TCS share price change signals confidence in AI-driven services and margin discipline, even in a backdrop of macro uncertainty. The stock’s current valuation sits in a zone that rewards quality, scale, and the ability to translate AI investments into earnings growth over time.
Infosys Stock Price And The IT Rally: A Sector Wide Move
Infosys stock price participated in the rally as the IT sector extended gains beyond TCS. The Infosys stock price climbed 4% to Rs 1,091, coinciding with a broader mood that large-cap IT names can navigate inflationary pressures and wage dynamics while pursuing AI-enabled growth. The continued strength in Infosys and other large-cap peers reflects improving demand in select pockets, as well as an ongoing shift toward higher-value services that command premium pricing.
Wipro stock price moved higher by more than 2% to Rs 177, consistent with a sector-wide revaluation as investors chase consistency in earnings growth and AI-enabled services' potential. Midcap IT names Coforge, Persistent Systems, Oracle Financial Services, and L&T Technology Services also advanced, rising as much as 3%, signaling that the rally is broad-based rather than a narrow leadership push.
Brokerage Perspective On TCS Valuation: Upgrades And Targets
Nuvama’s bullish view on TCS centers on margins and deal wins, projecting a 46% upside from current levels. MOFSL’s Buy rating carries a target price of Rs 2,350, suggesting about 15% upside, with the team noting that growth in 2Q will be driven by selective pockets rather than broad-based acceleration. Dolat Capital’s upgrade to Buy with a target of Rs 2,580 puts the stock at roughly 16x FY28E earnings of Rs 161.5. Taken together, these views reflect optimism that AI-enabled offerings and resilient services demand can sustain valuation momentum despite ongoing macro headwinds.
More specifically, MOFSL’s commentary notes that management’s 2Q demand improvement is expected to come from “select pockets,” while 1QFY27 commentary exceeded expectations. This nuance matters for investors who prefer a stock-picking approach within IT – a sector where winners are increasingly defined by executable AI strategies, client wins, and margin discipline rather than headline revenue alone.
For retail investors seeking a disciplined way to navigate this rally, the emphasis should be on quality earnings growth, sustainable margins, and the ability to monetize AI investments. Swastika's Sarthi AI stock assistant can help tailor stock ideas to your risk profile and investment horizon.
Midcap IT Stocks In Focus: Coforge, Persistent Systems, Oracle Financial Services, And L&AmpT Technology Services
Coforge, Persistent Systems, Oracle Financial Services, and L&T Technology Services resonated with the broader sector strength, each rising up to 3%. These midcap names illustrate how the IT services ecosystem is widening beyond the largest players, with execution momentum in cloud-native projects and AI-enabled offerings supporting earnings growth. The rally in persistent systems stock reflects improving margins and deal wins in cloud, data, and AI-enabled services, underscoring the sector’s shift toward higher-value, subscription-style models.
The performance of persistent systems stock is particularly noteworthy as investors look for durable growth trajectories in midcaps. While macro pressures persist, the growth in AI-enabled capabilities and partnerships is translating into visible value creation for select players with strong execution and scalable delivery models.
Investors should keep an eye on sector-wide indicators such as the Nifty IT index and the performance of other large-cap IT names to gauge the strength of the rally. A diversified approach that balances valuations, risk tolerance, and time horizon can help you participate in momentum while managing downside risk.
How To Use This IT Rally For Your Portfolio
Practical steps to align with the IT rally include focusing on quality earnings growth and margin resilience, maintaining diversified exposure across large-cap leaders like TCS and Infosys, and using risk-managed entry points into midcaps with AI-enabled strengths. The rally is underpinned by AI-led opportunities that can unlock higher-value services, but valuations vary across names. Investors should combine a stock-picking approach with a macro-aware framework–watch for secular demand momentum, cloud migrations, and automation adoption that translates into sustainable cash flows.
Related Reads
- TCS share price Outlook: Brokerages Cut Targets On Tata Consultancy Services And The IT Sector
- TCS Share Price Outlook: Q1FY27 Preview, AI Momentum, And Growth Signals
- TCS Share Price Crash Signals Deep IT Sector Repricing And Opportunities
Frequently Asked Questions
Which IT stocks moved higher after TCS's Q1 results?
Infosys stock price rose 4% to Rs 1,091; hcl tech stock price gained around 4% to Rs 1,192; mahindra tech stock price rose around 4% to Rs 1,478; stock price of wipro added over 2% to Rs 177. Midcap IT stocks Coforge, persistent systems stock, Oracle Financial Services, and l&t technology services stock also rose, each by up to 3% as the Nifty IT index climbed.
What happened to the TCS share price on the day of the Q1 results?
The tcs share price advanced 3.5% to Rs 2,118 during the session as the broader IT rally gained momentum following the better-than-expected Q1 performance.
What are brokerages saying about TCS valuations after Q1?
Nuvama sees a 46% upside, MOFSL has a Buy with a target price of Rs 2,350 (about 15% upside), and Dolat Capital upgrades to Buy with a target of Rs 2,580 (around 26% upside). They cite resilient margins, solid deal wins, and AI-led opportunities as key drivers.
Which midcap IT stocks led the rally alongside TCS?
Coforge, Persistent Systems, Oracle Financial Services, and L&T Technology Services rose as much as 3%, signaling broad participation beyond the top-tier names in the IT index.
What is the broader takeaway for retail investors from this IT rally?
The rally reflects margins resilience and AI-led growth potential amid macro uncertainty. Retail investors should focus on durable AI-enabled services, selective P/L growth pockets, and maintain a balanced approach to risk, using tools like Swastika's Sarthi AI stock assistant to tailor ideas to risk tolerance.
Conclusion
The IT sector’s resilience in margins and AI-led opportunities is drawing fresh investor interest even as macro uncertainty persists. For retail investors, the key takeaway is to focus on durable, AI-enabled growth, monitor margin trajectory and deal wins, and maintain a balanced, risk-aware approach to stock selection.
Open your trading and demat account here
Reference :
1 : Economictimes

Vedanta Aluminum Stock: Growth Drivers, Debut Details, And Risks For 2026
Key Takeaways
- vedanta aluminum stock stands as India's largest pure-play primary aluminum company and the third-largest globally outside China.
- EBITDA is forecast to grow over 18% CAGR FY26-28, driven by volume expansion, cost cuts, and value-added products.
- Motilal Oswal has a Buy rating with a Rs 540 target, implying about 22% upside from the prior close.
- Demerger debut on June 15 priced vedanta aluminum stock at Rs 522; current market cap around Rs 1.73 lakh crore.
vedanta aluminum stock stands at the crossroads of a fast-growing Indian demand and a global supply squeeze – a dynamic that could re-rate valuations if volume growth, structural cost relief, and more value-added products align. vedanta aluminum stock is India's largest pure-play primary aluminum company and the third-largest aluminum producer globally, excluding China. The stock debuted on June 15 at Rs 522 per share after a mega demerger that spun out four new companies, and the vedanta aluminum stock price has since moved to Rs 443.80 per share, a decline of about 15% in under a month. The company currently has a market capitalization around Rs 1.73 lakh crore, while debut market cap was over Rs 2 lakh crore. Domestic brokers have signaled strong earnings growth and cash flow generation in the medium term. The backdrop of a structurally tighter global aluminum market outside China, coupled with India's robust demand growth, creates a potentially favorable setup for vedanta aluminum stock. For retail investors, the question is whether the fundamentals justify a structural re-rating despite near-term volatility.
Vedanta Aluminum Stock: The Indian Leader In Primary Aluminum And Global Standing
Vedanta Aluminum stock represents the apex of Indian aluminum exposure in a market where supply discipline outside China has tightened. The company is described as India's largest pure-play primary aluminum company, and it is the third-largest aluminum producer globally when excluding China. This global standing matters because it positions the stock to capture benefits from a tighter aluminum market outside the world’s largest producer. In addition to scale, the business has a strong backing by the Vedanta Group, which supports capital allocation and strategic execution. The combination of domestic market strength and global position helps explain why street analysts cite favorable earnings trajectories and the potential for a structural re-rating as the company executes its plan to become more captive and backward integrated.
Demerger Debut: How Vedanta Aluminum Stock Became A Market Watch
The listing story for vedanta aluminum stock began on June 15 when the shares were priced at Rs 522. This debut price set a high-water mark for the stock’s early narrative, as it reflected a moment when investors priced in the potential of a stand-alone aluminum champion emerging from a broader conglomerate. In the weeks that followed, the stock retraced about 15% from the listing price and closed around Rs 443.80 apiece. The initial market capitalization at debut exceeded Rs 2 lakh crore, a gauge of the scale investors anticipated for the aluminum subsidiary of the Vedanta Group. Presently, the market capitalization sits around Rs 1.73 lakh crore, illustrating a common post-listing adjustment where early enthusiasm moderates as the stock begins to trade on standalone fundamentals.
Growth Drivers Behind Vedanta Aluminum Stock: Volume Expansion, Cost Reductions, And Value-Added Products
Analysts expect vedanta aluminum stock to display robust earnings growth in the medium term, buoyed by three concurrent forces. First, volume expansion: as India’s demand for aluminum intensifies across construction, packaging, and electricals, Vedanta Aluminum stands to benefit from higher production volumes. Second, structural cost reductions: ongoing efforts to improve efficiency, optimize input costs, and leverage scale are expected to shrink the cost base, supporting higher EBITDA margins. Third, value-added products: increasing contribution from higher-margin value-added aluminum products will widen the margin mix and enhance cash flow generation. Taken together, the brokerage view suggests an EBITDA CAGR of over 18% between FY26 and FY28, a projection that aligns with both volume growth and a favorable cost structure. In an environment where the global aluminum market is tightening due to China’s production cap, disruptions in Europe and Russia, and years of underinvestment outside China, the case for vedanta aluminum stock rests on a combination of domestic demand resilience and supply-side discipline on the global stage. The Indian market’s robust demand trajectory also feeds a substantial opportunity for import substitution, which can support a favorable pricing environment for the company. As the company moves toward greater captive operations and backward integration, the valuation multiples could re-rate further as predictable cash flows strengthen investor confidence. For investors seeking to track these dynamics, it’s essential to watch the evolution of volume, unit costs, and the mix of value-added products over the next few quarters.
Analyst View: Motilal Oswal's Buy Call On Vedanta Aluminum Stock
A key bullish view on vedanta aluminum stock emerges from a Buy rating and a target price of Rs 540, implying an upside of approximately 22% from the stock’s previous close. This outlook underscores confidence in the company’s earnings growth and cash flow prospects over the medium term, driven by the trilogy of volume growth, cost optimization, and higher value-added products. The broker’s stance reflects an expectation that the structural re-rating could occur as the company advances its backward integration and captive strategies, reducing exposure to external supply shocks and improving cost competitiveness. While the upside scenario is compelling, the risk factors highlighted by the brokerage–execution risk, aluminum price volatility, input cost inflation, and trade-related challenges–remain at the top of mind for investors. The balance of these factors will shape the stock’s trajectory as it continues to execute its strategic plan.
Key Risks And Safeguards For Vedanta Aluminum Stock
As with any commodity-linked equity, vedanta aluminum stock carries several material risks. Execution risk stands out because the company’s plan depends on successful ramp-ups, project completions, and timely realization of efficiency gains. Aluminum price volatility can compress margins if raw material costs rise faster than the price realizations the firm can secure in its product mix. Input cost inflation, including energy and key inputs used in aluminum production, could constrain earnings if not offset by productivity or pricing power. In addition, trade-related challenges–tariff changes, duties, and policy shifts–could alter the competitive landscape and impact export or import dynamics. The investment thesis rests on the ability to manage these risks while continuing to capitalize on India’s favorable demand environment and the global supply-tight backdrop outside China.
Valuation Trends And Market Dynamics For Vedanta Aluminum Stock
The aluminum market globally remains structurally tight outside China, a trend supported by China's production cap, ongoing disruptions in Europe and Russia, and years of underinvestment beyond China’s border. For vedanta aluminum stock, this backdrop could translate into favorable demand-supply dynamics and container-friendly pricing, particularly with India’s escalating demand and import substitution opportunities. The transition toward captive and backward integration echoes through the market’s broader rotation toward companies that can demonstrate predictable cash flows and cost efficiency. In this context, the stock’s valuation multiple could re-rate as earnings visibility solidifies and the company’s capital allocation aligns more closely with shareholder value creation. Investors should monitor how the company sustains volume growth, improves its cost curve, and expands its share of higher-margin value-added products as catalysts for a potential re-rating.
Frequently Asked Questions
What is Vedanta Aluminum stock?
Vedanta Aluminum stock refers to Vedanta Aluminum, India's largest pure-play primary aluminum company and the third-largest aluminum producer globally outside China.
What did Motilal Oswal say about Vedanta Aluminum stock?
Motilal Oswal Financial Services initiated coverage on Vedanta Aluminum with a Buy rating and a target price of Rs 540, implying an upside of about 22% from the stock's previous closing price.
What are the growth drivers for Vedanta Aluminum stock in FY26-28?
EBITDA is forecast to post over 18% CAGR over FY26-28, driven by volume expansion, structural cost reductions, and an increasing contribution from value-added products.
What were Vedanta Aluminum stock's listing details and current market cap?
The shares listed on June 15 at Rs 522 per share. The debut market cap was over Rs 2 lakh crore, and the current market capitalization is around Rs 1.73 lakh crore.
What are the key risks to Vedanta Aluminum stock?
Key risks include execution risks, aluminum price volatility, input cost inflation, and trade-related challenges.
Conclusion
Vedanta Aluminum stock sits at an inflection point where a favorable global aluminum backdrop meets India’s growing consumption and a company-focused plan for captive supply and value-added products. For retail investors, the setup combines meaningful growth with tangible risks–chiefly execution and commodity-price volatility. The key is balancing the structural upside from tight markets and Indian demand with proactive risk management around costs and external disruptions. As always, a disciplined approach–clarified by clear entry levels, stop-loss discipline, and ongoing monitoring of volume trends, cost improvements, and product mix–will determine how this stock fits into a broader portfolio. For deeper, stock-specific insights, you can explore Swastika's Sarthi AI stock assistant: Swastika's Sarthi AI stock assistant.
In practical terms, investors could consider a phased approach to building exposure, layering in additional units as volume growth materializes and cost improvements prove durable. The story is as much about the resilience of demand in India as it is about the efficiency of the aluminum value chain outside a tightly regulated global market. If vedanta aluminum stock can deliver on the promised EBITDA expansion and cash flows while managing execution risks, the stock could remain a focal point for retail investors seeking exposure to metals-cycle opportunities intertwined with India’s growth story.
Open your trading and demat account here
Reference :
1 : Economictimes
.jpg)
Dixon-Vivo Joint Venture: What Investors Need to Know About the New Manufacturing Partnership
India's electronics manufacturing sector has received another major boost as Dixon Technologies and Vivo Mobile India move ahead with their joint venture (JV) in smartphone manufacturing. After receiving government approval, the partnership is expected to strengthen India's position as a global smartphone manufacturing hub while creating new growth opportunities for Dixon.
What is the Dixon-Vivo Joint Venture?
Dixon Technologies and Vivo Mobile India have entered into a new manufacturing joint venture, with:
- Dixon Technologies owning 51%
- Vivo Mobile India owning 49%
The Government of India has approved Vivo's investment, allowing the company to proceed with incorporation of the JV. The newly formed company will manufacture Vivo smartphones in India and can also undertake electronics manufacturing for other brands, providing long-term expansion opportunities.
The joint venture begins with an initial paid-up capital of ₹5 crore, distributed according to the ownership ratio.
Why Did Dixon and Vivo Form this Joint Venture?
The partnership offers strategic benefits to both companies. For Vivo, it strengthens local manufacturing while supporting India's Make in India initiative and reducing dependence on imports. For Dixon, the JV secures long-term manufacturing volumes from one of India's largest smartphone brands while expanding its electronics manufacturing services (EMS) business.
Unlike a traditional contract manufacturing agreement, this partnership creates a deeper business relationship, making it more stable over the long term.
How will the Dixon-Vivo Joint Venture Work?
Once incorporated, the joint venture will become a subsidiary of Dixon Technologies. The company will:
- Acquire selected manufacturing assets
- Manufacture and package Vivo smartphones
- Offer OEM manufacturing services for other electronics brands
- Operate under a board where both Dixon and Vivo nominate two directors each
This governance structure gives both companies equal representation while Dixon retains majority ownership.
The Importance of the Dixon-Vivo JV for Investors?
For investors, this is much more than a manufacturing agreement. The partnership significantly increases Dixon's future production capacity and strengthens its position as India's leading electronics manufacturing company.
Several factors make the deal noteworthy:
- Long-term manufacturing commitment from Vivo
- Higher smartphone production volumes
- Opportunity to attract additional OEM clients
- Expansion into higher-value smartphone manufacturing
- Improved capital efficiency despite slightly lower margins
Overall, the JV improves business visibility for the coming years.
How Many Smartphones will Dixon Manufacture Under the JV?
One of the biggest investor questions is about production volume. Analysts expect Dixon to manufacture approximately:
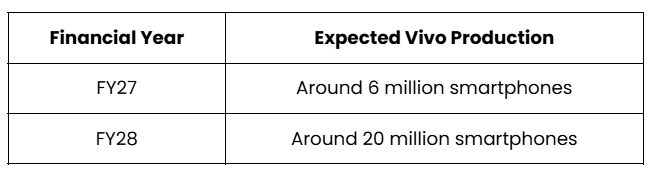
Management expects the partnership to eventually contribute 20–22 million smartphones annually. Considering Dixon manufactured approximately 32–33 million smartphones in FY26, the JV could significantly increase overall manufacturing volumes.
Expected total production:
- FY27: 43–45 million smartphones
- FY28: 55–58 million smartphones
This represents substantial growth in manufacturing scale.
Will the Dixon-Vivo JV Increase Revenue?
Most analysts believe the answer is yes. Since Vivo commands one of India's largest smartphone market shares, higher manufacturing volumes are expected to translate into significantly higher revenue.
According to analyst estimates:
- Revenue forecasts have been increased by 24–39% for FY27–FY29 by some brokerages.
- Earnings estimates have also been revised upward following the announcement.
Higher production volumes remain the primary growth driver.
Will the Joint Venture Improve Dixon's Profit Margins?
Not necessarily. This is one of the most discussed aspects of the deal. Analysts expect the Vivo business to operate at slightly lower manufacturing margins compared to Dixon's existing portfolio.
Estimated impact:
- Margin dilution of approximately 10–40 basis points during FY27–FY29.
However, lower margins don't automatically mean weaker financial performance. The business is expected to generate faster asset turnover, improving capital efficiency.
How could the JV Affect Dixon's ROCE?
One of the biggest positives highlighted by analysts is the expected improvement in Return on Capital Employed (ROCE). Despite lower margins, higher asset utilisation could increase ROCE by approximately 400–700 basis points. For long-term investors, improving capital efficiency often matters as much as improving operating margins.
Why are Higher Smartphone Realisations Important?
Another positive factor is product mix. Vivo smartphones generally command 20–30% higher average selling prices than many devices currently manufactured by Dixon. Higher realisations help offset part of the expected margin pressure while increasing revenue per device manufactured.
How Does this Fit Into India's Manufacturing Strategy?
The JV aligns with India's broader manufacturing push. Recent government initiatives include:
- Faster approval timelines for investments from neighbouring countries
- Duty exemptions on several electronics manufacturing inputs until March 2029
- Increased support for electronics component manufacturing
These policy measures are designed to strengthen India's electronics ecosystem and attract additional manufacturing investments. For Dixon, this creates a supportive operating environment over the coming years
What Risks Should Investors Watch?
While the opportunity is significant, investors should monitor several execution risks.
Production Ramp-Up
Meeting projected manufacturing volumes during FY27 and FY28 will be critical.
Margin Pressure
If manufacturing margins decline more than expected, earnings growth could moderate.
Customer Concentration
Although the JV provides stable volumes, heavy dependence on one major client can increase business concentration risk.
Execution
Successfully integrating manufacturing assets and scaling production efficiently will determine whether analyst expectations are achieved.
Is the Dixon-Vivo Joint Venture Good for Dixon Shareholders?
Based on current analyst commentary, the joint venture appears strategically positive. The partnership offers:
- Higher manufacturing volumes
- Stronger revenue visibility
- Better capital efficiency
- Long-term customer commitment
- Expansion opportunities beyond Vivo
The primary trade-off is slightly lower operating margins, although analysts generally expect improved returns on capital to offset much of this impact. For long-term investors, execution will remain the key factor to monitor over the next two financial years.
Frequently Asked Questions (FAQs)
Is the Dixon-Vivo joint venture approved?
Yes. The Government of India has approved Vivo's investment, allowing the joint venture to proceed with incorporation.
What is Dixon's ownership in the JV?
Dixon Technologies will own 51%, while Vivo Mobile India will hold 49%.
How many smartphones will the JV manufacture?
Analysts expect approximately 6 million smartphones in FY27 and 20 million in FY28, with annual production eventually reaching 20–22 million units.
Will the JV improve Dixon's earnings?
Most brokerages expect higher revenue and earnings because of increased production volumes, although operating margins may see a slight decline.
Why is the Dixon-Vivo JV important?
The partnership secures long-term manufacturing business from one of India's largest smartphone brands, improves production scale, and strengthens Dixon's leadership in India's electronics manufacturing industry.
Conclusion
The Dixon-Vivo joint venture represents one of the most significant developments in India's electronics manufacturing sector. While investors should expect some pressure on operating margins, the partnership has the potential to drive higher manufacturing volumes, stronger revenue growth, and improved capital efficiency.
As the JV scales operations over FY27 and FY28, investors will be closely watching production execution, earnings growth, and whether the expected benefits translate into sustained shareholder value.
For the latest stock market news, company updates, IPO insights, expert analysis, and investment research, stay connected with Swastika Investmart. Our market experts regularly publish timely updates and in-depth insights to help investors navigate the evolving financial markets with confidence.
Big Budget


Popular Articles


.avif)
.avif)

.avif)


START YOUR INVESTMENT JOURNEY
Get personalized advice from our experts
- Dedicated RM Support
- Smooth and Fast Trading App
