FII FPI & DII Trading Activity on 6 April 2026 : Key Insights from April 6, 2026


%20(3).webp)

Understanding FII vs DII trading activity today is essential for anyone tracking the Indian stock market. On 06 April 2026, the divergence between Foreign Institutional Investors (FIIs) and Domestic Institutional Investors (DIIs) once again highlighted how global and local sentiments shape market direction.
FIIs were strong sellers, while DIIs stepped in aggressively to support the market. Let’s break down what this means and how investors should interpret these signals.
Key Highlights at a Glance
- FIIs remained net sellers, indicating cautious global sentiment
- DIIs continued strong buying, supporting market stability
- Domestic liquidity is currently cushioning foreign outflows
- Market direction may remain range-bound in the short term
FII vs DII Activity Today: Data Breakdown
On 06 April 2026, in the capital market segment:
- FIIs sold equities worth ₹7,839 crore (NSE) and ₹8,167 crore (combined exchanges)
- DIIs bought equities worth ₹7,950 crore (NSE) and ₹8,088 crore (combined exchanges)**
This clearly shows a tug-of-war between foreign selling and domestic buying.
Why Are FIIs Selling?
Foreign Institutional Investors often react to global macroeconomic factors. Key reasons behind the current selling trend include:
1. Global Uncertainty
Rising interest rates in developed economies and geopolitical tensions can trigger capital outflows from emerging markets like India.
2. Dollar Strength
A stronger US dollar reduces the attractiveness of Indian equities for FIIs.
3. Profit Booking
After recent rallies, FIIs may be locking in profits, especially in large-cap stocks.
Why Are DIIs Buying Aggressively?
Domestic Institutional Investors, including mutual funds and insurance companies, are playing a stabilizing role.
1. Strong Retail Inflows
Consistent SIP inflows into mutual funds are giving DIIs steady liquidity.
2. Long-Term Outlook
DIIs focus more on India’s long-term growth story rather than short-term volatility.
3. Market Correction Opportunities
DII buying often increases when markets dip, helping maintain balance.
Impact on Indian Stock Market
The contrasting behavior of FIIs and DIIs creates a balanced market environment.
Short-Term Impact
- Markets may remain volatile
- Sector rotation is likely
- Midcaps and smallcaps could see selective action
Long-Term Impact
- Domestic liquidity is becoming a key pillar
- Reduced dependence on foreign capital
- Stronger resilience during global shocks
Regulatory bodies like the Securities and Exchange Board of India and Reserve Bank of India continue to ensure market stability and transparency, which further strengthens investor confidence.
What Should Investors Do?
Understanding FII vs DII trends can help you make smarter investment decisions:
- Avoid panic selling during FII outflows
- Focus on fundamentally strong companies
- Use market dips as buying opportunities
- Track sector-wise FII and DII movement
Role of Swastika Investmart
In such dynamic market conditions, having the right platform and research support matters. Swastika Investmart stands out as a SEBI-registered broker offering:
- Advanced research and advisory tools
- Reliable and responsive customer support
- A tech-driven platform for seamless trading
- Strong focus on investor education
These features help investors navigate volatile markets with confidence.
Frequently Asked Questions
What is FII vs DII activity?
FII vs DII activity refers to the buying and selling of stocks by foreign and domestic institutional investors in the market.
Why do FIIs impact the market more?
FIIs bring large volumes of capital, so their buying or selling can significantly influence market trends.
Is DII buying a positive sign?
Yes, strong DII buying indicates confidence in the domestic economy and can stabilize markets during FII selling.
How can I track FII and DII data daily?
You can track it through stock exchange websites like NSE and BSE or brokerage platforms offering market insights.
Final Thoughts
The ongoing trend in FII vs DII trading activity today shows that while global investors remain cautious, domestic institutions are strongly backing the Indian market. This balance is crucial for maintaining stability.
For investors, the key is to stay informed, avoid emotional decisions, and focus on long-term growth opportunities.
If you want to make smarter investment decisions backed by research and technology, explore Swastika Investmart here:
Big Budget


.webp)
.webp)
.webp)
.webp)
.webp)


.webp)
.webp)
.webp)
.webp)
Latest Articles

KSH International IPO Review 2025: Should You Apply? A Detailed Analysis of Business, Growth, and Investment Potential.


Key Takeaways
- KSH International is a leading manufacturer and exporter of magnet winding wires with strong exposure to EVs and power infrastructure
- FY25 ROE of 22.77 percent and improving margins highlight efficient operations
- IPO valuation is reasonable but not cheap due to relatively higher leverage
- Suitable for long-term investors rather than aggressive listing gains seekers
Understanding KSH International’s Business Model
KSH International is engaged in the manufacturing and export of magnet winding wires, a critical component used in motors, transformers, generators and other electrical equipment. These products play a vital role in sectors such as power transmission, renewable energy, electric vehicles, railways, industrial machinery and automotive applications.
The company offers a wide range of products including enamelled copper and aluminium winding wires, paper insulated rectangular wires, continuously transposed conductors and specialised insulated conductors. These products are supplied to large original equipment manufacturers across India and overseas markets.
What makes KSH International relevant in today’s market environment is its direct linkage to India’s long-term infrastructure story. With rising investments in power generation, EV manufacturing and renewable energy, demand for efficient and reliable magnet winding wires is expected to remain strong.
Manufacturing Strength and Industry Position
KSH International operates three manufacturing facilities in Maharashtra located at Taloja and Chakan, with a total installed capacity of 29,045 metric tonnes per annum. A fourth manufacturing facility at Supa in Ahilyanagar is under development and expected to commence operations in FY26, further strengthening capacity.
As per industry data, the company ranks as India’s third-largest manufacturer and the largest exporter of magnet winding wires in FY25. Its strong export presence provides diversification and reduces dependence on a single geography.
The company has also received quality and supplier excellence awards from reputed clients such as Toshiba T&D India, GE Power Grid and BHEL, reinforcing its credibility in a highly technical manufacturing segment.
Financial Performance and Growth Trends
KSH International has demonstrated consistent financial improvement over the last three years. Total income increased from ₹1,056.60 crore in FY23 to ₹1,938.19 crore in FY25, reflecting strong demand across end-use industries.
Profitability has improved steadily, with net profit rising from ₹26.61 crore in FY23 to ₹67.99 crore in FY25. EBITDA margins expanded from 4.72 percent to 6.32 percent during the same period, indicating better operating efficiency and cost control.
Return on equity for FY25 stands at a healthy 22.77 percent, which is higher than many listed peers in the magnet wire segment. This reflects effective capital utilisation and disciplined execution by the management.
IPO Details You Should Know
The KSH International IPO is a book-built issue with a price band of ₹365 to ₹384 per share. The issue opens for subscription on December 16, 2025 and closes on December 18, 2025. The shares are proposed to be listed on both BSE and NSE.
The total issue size is ₹2,601.82 crore, consisting of a fresh issue of ₹710 crore and an offer for sale of ₹1,891.82 crore. The face value of each share is ₹5 and the market lot is 39 shares.
Post issue, the company’s market capitalisation is estimated at approximately ₹2,602 crore at the upper price band.
Use of IPO Proceeds and Strategic Focus
The company plans to utilise fresh issue proceeds primarily for repayment of certain borrowings, purchase and installation of new machinery at two manufacturing plants, and setting up a rooftop solar power plant at its Supa facility.
These initiatives are expected to support capacity expansion, improve energy efficiency and reduce power costs over the long term. Investment in renewable energy also aligns with sustainability goals and may provide cost advantages as electricity prices remain volatile.
Valuation and Market Comparison
At the upper price band, KSH International is valued at a pre-IPO P/E of around 32 times FY25 earnings. Compared with listed peers such as Precision Wires India and Ram Ratna Wires, the valuation appears reasonable but not deeply discounted.
While KSH International offers superior ROE and strong growth visibility, its debt levels are relatively higher than some peers. This may limit near-term re-rating potential, especially for investors focused on short-term listing gains.
From a long-term perspective, the valuation reflects the company’s growth prospects, export leadership and exposure to high-growth sectors like EVs and renewables.
Key Risks Investors Should Consider
The company derives a significant portion of its revenue from a limited number of large customers, which could impact earnings if client concentration increases. Raw material price volatility, particularly in copper and aluminium, can also affect margins.
Manufacturing operations involve operational risks such as equipment failure and force majeure events. Additionally, differences in accounting standards across jurisdictions may impact financial interpretation for some investors.
Should You Apply for KSH International IPO
For listing gains seekers, the IPO may offer limited upside due to fair valuation and higher leverage compared to peers. However, for long-term investors, KSH International presents a strong structural growth story driven by electrification, EV adoption and infrastructure spending in India.
Investors with a long-term horizon and moderate risk appetite may consider the IPO as part of a diversified portfolio, keeping expectations realistic in the short term.
How Swastika Investmart Can Help You Invest Smarter
Choosing the right IPO is not just about numbers but about understanding risk, valuation and timing. Swastika Investmart, a SEBI registered entity, provides in-depth research, advanced trading tools, strong customer support and investor education to help retail investors make informed decisions.
If you are planning to apply for IPOs or build a long-term equity portfolio, opening an account with Swastika Investmart gives you access to professional insights and a tech-enabled investing experience.
Frequently Asked Questions
What does KSH International do?
KSH International manufactures magnet winding wires used in motors, transformers, EVs and power equipment.
Is KSH International profitable?
Yes, the company reported a net profit of ₹67.99 crore in FY25 with an ROE of 22.77 percent.
What is the IPO price band?
The IPO price band is ₹365 to ₹384 per share.
Is the IPO good for listing gains?
Listing gains may be moderate as the valuation is fair but not cheap.
Is it suitable for long-term investors?
Yes, long-term investors may find value due to strong industry tailwinds and expansion plans.
Has the Midcap–Smallcap Panic Finally Ended? Signs the Market May Have Formed a Bottom
Key Takeaways
- Panic selling in midcap and smallcap indices has eased, showing early signs of bottom formation.
- Valuations have cooled, SIP flows remain steady, and regulatory interventions have stabilised sentiment.
- Institutional buying and volatility compression signal returning confidence.
- Investors should stay selective, focusing on quality, earnings visibility, and balance-sheet strength.
- Swastika Investmart’s research-driven approach can help navigate this recovery phase.
The recent sell-off in India’s midcap and smallcap space sent shockwaves through the market. After months of outperformance, these segments corrected sharply as investors reacted to frothy valuations, regulatory caution from SEBI, and global uncertainty.
But the big question now is: Has the panic finally ended? There are early signs that the market may be stabilising — and possibly forming a short-term bottom.
Let’s break down what’s happening, what signals matter, and how investors should position themselves.
What Triggered the Panic in Midcap and Smallcap Stocks?
The correction didn’t happen in isolation. Multiple triggers set the tone:
1. Valuation Excesses
Midcaps and smallcaps had rallied far beyond their historical averages. Many stocks were trading at 30–50% premiums despite modest earnings visibility.
This stretched the risk-reward equation, making the segment vulnerable to a correction.
2. SEBI’s Risk Alert
SEBI issued cautionary comments regarding overheating in smaller companies, urging mutual funds to reassess risk frameworks.
While not a direct intervention, it created a sentiment shock, leading to profit-booking and fund rebalancing.
3. Global Uncertainty
Concerns over US bond yields, geopolitical tensions, and FII outflows added fuel to the fire. With risk-off sentiment globally, smallcaps took the hardest hit.
4. Mutual Fund Rebalancing
Many schemes faced pressure to rebalance portfolios due to size restrictions and liquidity management rules, further accelerating the decline.
Is the Midcap–Smallcap Bottom In? Key Signs of Stabilisation
Now, the dust is beginning to settle — and several indicators suggest a bottom may be forming.
1. Selling Pressure Has Eased
The pace of declines has slowed significantly. Earlier, deep cuts of 4–6% were common in a day; now, volatility has tapered.
This cooling-off reflects reduced panic and more measured trading activity.
2. Volatility Compression
The India VIX remains within a controlled range, signalling improving risk appetite. Historically, midcap recoveries begin when volatility stabilises first.
3. Steady SIP Inflows
Despite sharp corrections, SIP contributions hit all-time highs, showing unwavering domestic investor faith.
Consistent inflows act as shock absorbers, reducing the likelihood of prolonged downturns.
4. Institutional Buying Is Back
Domestic institutional investors have started nibbling into quality smallcap and midcap names—especially in sectors like capital goods, defense, manufacturing, and financial services.
When institutions buy during corrections, it often marks the beginning of base formation.
5. Earnings Have Held Up
Indian corporates have delivered stable earnings. Several smaller companies reported healthy margins, strong order books, or improved cash flows — not characteristics of a market in deep distress.
6. Regulatory Clarity from SEBI
SEBI’s recent stance has shifted from caution to structured monitoring. Clear guidelines always reduce fear-driven volatility.
Once the overhang of regulatory uncertainty eases, quality stocks typically rebound sooner.
7. Historical Cycles Support the Trend
Past midcap–smallcap corrections (2013, 2018, 2020) show a similar pattern:
- Sharp decline
- Panic selling
- Sentiment stabilisation
- Slow accumulation phase
- Sectoral rotation
- Recovery
Markets seem to be entering the accumulation zone now.
What Should Investors Do Now? A Practical Guide
A bottoming market can be a golden opportunity — but only with the right strategy.
1. Focus on Quality Over Momentum
Companies with:
- Low leverage
- Consistent cash flows
- Strong promoters
- Predictable earnings
… are likely to lead the recovery.
2. Avoid “Penny Move” Traps
A rising tide won’t lift all boats. Many questionable smallcaps jumped in the rally but lack fundamentals.
Stay selective and avoid speculative bets.
3. Use SIPs and STPs Smartly
Instead of trying to catch the exact bottom, stagger your entry over 4–6 months.
This cushions volatility and improves long-term returns.
4. Look at Sectors with Structural Tailwinds
Segments showing resilience include:
- Capital goods
- Manufacturing and industrials
- Financial services
- Defense
- Railways
- Renewables
- Building materials
These sectors continue to receive policy support and strong domestic demand.
5. Review Portfolio Allocation
If your equity allocation has fallen due to the correction, rebalancing can boost long-term compounding.
6. Use Research-backed Tools
Platforms with robust screening tools, research reports, and advisory support can help you avoid mistakes.
This is where a trusted financial partner becomes invaluable.
Why Swastika Investmart Can Help You Navigate This Phase
Swastika Investmart, a SEBI-registered financial services provider, offers:
- In-depth equity research backed by data and market experience
- Advanced screening and analytics tools
- Dedicated customer support for investors across segments
- Tech-enabled platforms for effortless trading and investing
- Investor education initiatives designed to enhance financial literacy
In volatile markets, having a research-driven approach matters more than ever.
👉 Open an account today:
https://trade.swastika.co.in/?UTMsrc=HasTheMidcapSmallcapPanicFinallyEnded
FAQs
1. Are midcap and smallcap stocks safe to invest in now?
They are safer than during the peak, but selectivity is essential. Focus on companies with strong fundamentals.
2. Has the market definitely bottomed?
Not guaranteed — but key indicators show stabilisation and early signs of accumulation.
3. Should I stop SIPs during a correction?
No. Corrections increase long-term returns by lowering average cost.
4. Which sectors look promising after this correction?
Manufacturing, capital goods, financial services, and defense are showing resilience.
5. How long do recoveries usually take?
Historically, midcap–smallcap recoveries take 3–6 months to gain momentum after major corrections.
Conclusion
The midcap–smallcap panic appears to be cooling, with several signals pointing towards a potential bottom. While uncertainty remains, disciplined investing, quality stock selection, and data-backed decisions can turn this volatility into opportunity.
If you’re looking to navigate this phase with expert guidance, Swastika Investmart’s research-driven tools and advisory support can help you make informed decisions.

Nifty’s Santa Rally Pattern: Is December 20–Jan 5 Still a High-Probability Window for Returns?
Key Takeaways
- Historical data shows Nifty has delivered an 80% win rate during the Santa Rally window.
- Liquidity, festive spending, and global risk appetite often support this pattern.
- Not all years are positive—macros like FIIs, crude oil, and Fed policy matter.
- This year’s setup depends on domestic flows, RBI stance, and global volatility.
- Investors should stay data-driven and avoid emotional trading during year-end rallies.
Nifty’s Santa Rally Pattern: Is December 20–Jan 5 Still a High-Probability Window for Returns?
Every December, a familiar question resurfaces among Indian market participants:
“Will we see a Santa Rally this year?”
The Santa Rally—a phase between December 20 and January 5—is historically known for delivering strong positive returns in global equity markets. While the concept originated from US markets, the pattern has quietly taken shape in India as well.
And the numbers speak for themselves.
Over the last 20 years, Nifty has shown an 80% win rate during this period. That means in 16 out of 20 years, markets ended flat or positive.
Before we explore whether this year can repeat history, let’s look at the Table.
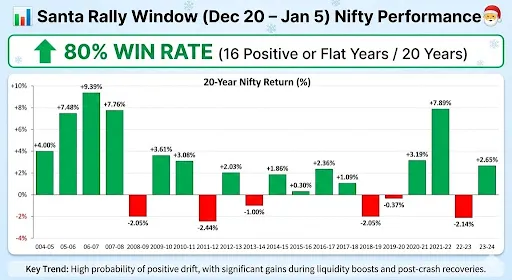
The Table highlights how often Nifty has delivered gains during this specific trading window. Notably big gains were observed in years following liquidity expansion phases or post-correction rebounds.
Some standout years include:
- 2005–06: +9.33%
- 2020–21: +7.89%
- 2006–07: +7.76%
Even in difficult cycles such as 2011–12 or 2015–16, the dips remained relatively contained.
The data hints at something deeper:
Investor behaviour, liquidity conditions, and institutional rebalancing consistently influence year-end trends.
Why Does the Santa Rally Happen in India?
1. Global Risk-On Sentiment
International markets often rally on:
- Year-end portfolio rebalancing
- Lower institutional trading volumes
- Festive optimism and reduced volatility
Nifty mirrors this behaviour, especially when FIIs turn buyers.
2. Domestic Liquidity Dominance
India’s rising SIP culture—now over ₹20,000 crore per month—creates a dependable liquidity cushion. Even when FIIs stay cautious, domestic institutions and retail flows provide strong support.
3. Corporate and Macro Visibility
By December:
- Most earnings downgrades are factored in
- Q3 outlook becomes clearer
- Global central bank signals stabilize
This reduces uncertainty, which markets love.
4. Event-Light Period
With major policy decisions and earnings behind us, markets enter a quieter news cycle—ideal for rallies.
Will Nifty See a Santa Rally This Year? Key Factors to Watch
Whether the Santa Rally returns this year depends on several moving parts.
1. FII and DII Behaviour
FIIs have been extremely sensitive to:
- US bond yields
- Dollar strength
- Emerging market valuations
If global yields cool and India remains the preferred EM destination, FIIs could drive a meaningful rally.
Meanwhile, DIIs continue to provide steady inflows regardless of global conditions.
2. RBI Policy Tone
A neutral-to-dovish stance from the RBI generally:
- Supports banking and rate-sensitive sectors
- Encourages broader market risk-taking
If inflation stays within comfort levels, the backdrop improves for a year-end run-up.
3. Crude Oil Volatility
For India, crude oil is the single biggest macro swing factor.
A stable or falling crude environment increases the probability of a Santa Rally.
4. Global Market Mood
If the US markets — especially S&P 500 and Nasdaq — carry momentum into the year-end, Nifty tends to follow suit.
Historically, India rarely rallies alone.
5. Technical Setup
Nifty’s technical structure going into December matters:
- Higher highs support continuation
- Consolidation ranges often lead to a breakout
- Overbought zones may limit upside
A neutral–positive structure improves the setup.
What Should Investors Do During a Potential Santa Rally?
1. Avoid Chasing Short-Term Euphoria
While Santa Rallies are common, relying on them as guaranteed is risky.
2. Keep Focus on High-Quality Stocks
Large caps tend to perform better due to stable liquidity.
3. Use Corrections to Accumulate
If volatility emerges, staggered buying helps reduce timing risk.
4. Don’t Ignore Global Triggers
Fed commentary, dollar index movement, and geopolitical risks can break the trend quickly.
5. Use Tools and Advisory Support
Platforms like Swastika Investmart, with SEBI-registered research and actionable insights, help investors stay aligned with data—not emotions.
FAQs
1. Does the Santa Rally always work in India?
No. While Nifty has delivered positive or flat returns in 80% of the last 20 years, external shocks or high valuations can offset historical patterns.
2. Why does Nifty usually rise between Dec 20 and Jan 5?
A mix of lower volatility, festive sentiment, portfolio rebalancing, and strong domestic flows often lifts markets.
3. Which sectors benefit the most during Santa Rallies?
Historically, banking, autos, consumer, and large-cap IT have shown stronger year-end momentum.
4. Is it safe to invest only for the Santa Rally?
Short-term bets are riskier. Long-term investors should view the rally as an opportunity, not a strategy.
5. What can break the Santa Rally this year?
Unexpected Fed remarks, Middle-East tensions, crude spikes, or heavy FII selling may cap returns.
Conclusion
The Santa Rally pattern in Nifty remains one of the most intriguing behavioural trends in the Indian market. Past data provides confidence—but not certainty. Whether this year repeats the 80% positive trend will depend on macro stability, global liquidity, and the market’s risk appetite.
For investors, the smartest approach is to stay data-driven and avoid knee-jerk decisions. Platforms like Swastika Investmart offer research-backed insights, strong customer support, and tech-enabled investing tools to help you navigate market opportunities confidently.
.webp)
Silver Supercycle 2025: Could Prices Really Shoot Up to ₹2 Lakh?
Key Takeaways
- Global supply constraints and rising industrial demand are reviving talks of a 2025 silver supercycle.
- Silver’s dual nature—industrial and precious metal—makes it highly sensitive to macro cycles.
- A ₹2 lakh/kg target is aggressive, but not impossible if inflation, clean energy demand, and geopolitical risks rise.
- Indian investors should track import duty policies, rupee movement, and global ETF flows.
- Silver remains a high-volatility asset; diversification is essential.
Silver Supercycle 2025: Could Prices Really Shoot Up to ₹2 Lakh?
Silver has always been the quieter cousin of gold—less flashy, more volatile, and often overlooked until a big move happens. But the conversation is heating up again. Several analysts and commodity strategists believe that 2025 could be the start of a major silver supercycle, one strong enough to push prices to ₹2,00,000 per kg in India.
Is this realistic or just another hype cycle?
Let’s break it down using real-world data, global trends, and India-specific context.
Why “Silver Supercycle 2025” Is Gaining Attention
A supercycle typically refers to a long, sustained rise in commodity prices caused by structural demand and limited supply. Historically, metals like copper, iron ore, and oil have experienced supercycles during periods of global expansion.
Silver is now entering a similar setup because of three major forces:
1. Exploding Industrial Demand
Silver is a critical input in:
- Solar panels
- Electric vehicles
- 5G devices
- Semiconductor manufacturing
- AI-driven hardware
- Medical equipment
The Solar Energy Industries Association estimates a gigantic jump in photovoltaic demand, potentially making silver one of the fastest-growing industrial metals in 2025.
2. Global Liquidity and Possible Rate Cuts
If the US Federal Reserve and other central banks move toward easing monetary policy, precious metals like silver typically rise due to:
- Lower real yields
- Weaker dollar
- Higher speculative interest
We saw this pattern during 2008–2011, when silver surged over 400%.
3. Tightening Supply and Mining Challenges
Mine production has lagged behind demand for years. Several major silver miners have reported:
- Lower ore grades
- Higher extraction costs
- Regulatory hurdles in Latin America
This mismatch between supply and demand is a classic trigger for a supercycle.
Can Silver Realistically Touch ₹2 Lakh per Kg in 2025?
Let’s look at the numbers.
Silver currently trades at approximately:
- ₹70,000–₹80,000 per kg (India)
- $22–$25 per ounce globally
For silver to reach ₹2,00,000 per kg, we would need:
- A 150%–180% price rise globally
- A stable to moderately weakening rupee
- Strong investment flows in global ETFs
- A surge in industrial consumption
While this is not the base-case expectation for most analysts, it is possible under a high-stress macro environment, such as:
- A global recession
- Major geopolitical escalation
- Aggressive central bank rate cuts
- Supply chain breakdowns
- A massive shift to renewable energy
Think of it this way:
Silver has rallied 10x in past cycles, most notably between 2003–2011. When silver runs, it really runs.
But it also corrects sharply.
This is why investors need a balanced view, not blind optimism.
How a Silver Supercycle Would Impact Indian Markets
India is one of the world’s largest consumers of silver—both industrially and as jewellery. The effects of a supercycle would be mixed:
1. Higher Import Bills
India imports most of its silver. A spike to ₹2 lakh/kg would put upward pressure on:
- Trade deficit
- Current account balance
- Rupee stability
This could indirectly influence stock markets via FII sentiment.
2. Boost for Solar and EV Stocks
Domestic companies in:
- renewable energy
- power equipment
- battery technology
- specialty chemicals
may face cost pressure but benefit from rising demand.
3. Increased Retail Participation
Indians traditionally buy silver during festivals and weddings. A price boom could push demand toward:
- Silver ETFs
- Silver ETPs
- Digital silver
- MCX silver derivatives
This aligns with India’s wider shift to formal financial instruments.
4. Impact on Jewellers
Jewellery players may see mixed results:
- Higher inventory values
- Lower retail demand
- Better margins if priced strategically
What Indian Investors Should Watch in 2025
Before assuming a supercycle, track these triggers:
1. RBI Policy and Rupee Movement
A weakening rupee can amplify silver prices far more than global moves.
2. India’s Import Duties
Any change in customs duty on silver impacts price directly.
3. MCX Volume Trends
Rising volumes can indicate rising speculative interest.
4. Global Silver ETF Flows
Institutional money is the real driver of supercycles.
5. Industrial Demand Data from China
China consumes nearly 50% of global silver. Its industrial recovery will be crucial.
FAQs
1. What is a silver supercycle?
It refers to a long-term surge in silver prices driven by strong structural demand and tight supply conditions across the global market.
2. Can silver really hit ₹2,00,000 per kg?
It’s an optimistic target. Achievable only if global liquidity, industrial demand, and supply disruptions align. Investors should consider it a possibility, not a certainty.
3. Is silver a better investment than gold in 2025?
Silver is more volatile but can deliver higher percentage returns during bull cycles. Gold, on the other hand, is more stable and defensive.
4. How should Indian investors buy silver?
Silver ETFs, MCX futures, and digital silver offer regulated and transparent access. Physical silver carries storage and purity risks.
5. Is now the right time to enter silver?
It depends on your risk profile. A staggered approach or SIP-style buying may help manage volatility.
Conclusion
The idea of a Silver Supercycle 2025 is exciting—and in many ways, credible. Industrial demand from solar and EVs is rising sharply, supply constraints are real, and global monetary cycles may turn favourable. But the jump to ₹2 lakh per kg requires an extraordinary combination of global events.
For Indian investors, the key is to stay informed, avoid speculative bets, and balance silver exposure within a diversified portfolio.
If you want expert guidance, market insights, and research-backed strategies, Swastika Investmart’s SEBI-registered advisory team and tech-enabled platforms can help you navigate commodity trends with confidence.
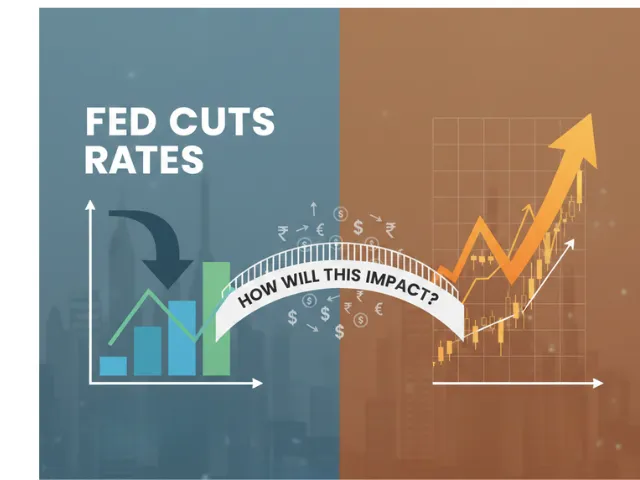
Fed Cuts Rates to 3.50%–3.75%: How Will This Impact Indian Stock Markets and Nifty?
Key Takeaways
- The US Federal Reserve has cut rates to 3.50%–3.75%, signaling a shift toward easing.
- Indian markets may see short-term volatility, but medium-term sentiment remains constructive.
- FIIs could increase flows into emerging markets if the dollar weakens.
- Rate-sensitive sectors in India—banks, NBFCs, real estate, autos—may see improved momentum.
- Nifty’s direction will depend on inflation, crude oil, domestic earnings, and global liquidity.
Fed Cuts Rates to 3.50%–3.75%: How Will This Impact Indian Stock Markets and Nifty?
The US Federal Reserve’s decision to cut interest rates to 3.50%–3.75% marks one of the most important policy shifts of the year. Whenever the Fed moves, global markets listen. And for India — now one of the world’s most influential emerging market economies — such a decision has both direct and indirect consequences.
Investors often wonder:
Will this boost Nifty?
Will FIIs return?
Will the market rally or consolidate?
This blog simplifies the answer with data-driven insights, Indian context, and real-world examples — written in a clear, natural, and professional style.
Why Did the Fed Cut Rates? A Quick Look at the Global Context
The Fed’s move comes on the back of a slowing US economy, easing inflation, and a need to support consumption and business borrowing. This pivot toward rate cuts signals:
- A softer interest-rate environment going forward
- Higher global liquidity
- A potential reversal of the strong US dollar trend
- Lower yields on US treasury bonds
Any of these factors can quickly alter the risk appetite of global investors — especially FIIs who influence Indian equity markets significantly.
How Fed Rate Cuts Affect the Indian Stock Market
Let’s break it down into simple, relatable impacts:
1. Impact on FIIs: Will Flows Return to India?
Generally, when US interest rates drop:
- US bond yields fall
- Dollar weakens
- Emerging markets become more attractive
For India, this is usually positive. Historically, we’ve seen this during:
- 2014–2015: Fed pause and liquidity boost → Heavy FII inflows → Nifty rallied
- 2020: Ultra-low US rates → Record inflows → Sensex touched new highs
If the current cut leads to a weaker dollar index, India could see:
- Renewed FII buying in banks, IT, capital goods
- Stabilizing currency volatility
- Higher participation in large-cap stocks
However, India is no longer dependent only on FIIs — strong domestic inflows provide a cushion even during global uncertainty.
2. Impact on Nifty: Short-Term Volatility, Medium-Term Tailwinds
Nifty’s immediate reaction may be choppy because markets had partially priced-in the rate cut.
But over the next quarter:
- Lower global borrowing costs
- Strong domestic GDP growth
- A supportive budget cycle
…could create a healthy setup for Nifty to trend positively, barring external shocks.
A key indicator to watch:
Crude oil. If oil stays below $85, India benefits.
3. Impact on the Indian Rupee
A Fed cut often reduces pressure on emerging market currencies. For the rupee:
- A stable or stronger INR reduces imported inflation
- Makes foreign borrowing cheaper for Indian corporates
- Improves investor confidence in rate-sensitive and import-dependent sectors
IT companies may see mild margin pressure if the rupee strengthens, but the overall direction remains sector-specific.
4. Sector-wise Impact on Indian Markets
Banking & NBFCs
Lower borrowing costs and better liquidity often support credit growth. Nifty Bank tends to benefit when yields soften globally.
IT & Tech
A weaker US dollar can reduce rupee revenues, but improved US business activity typically boosts demand for Indian IT services.
Real Estate
This sector thrives in lower-rate environments. Home loans could become more competitive if Indian rates also follow a softening path.
Autos
Lower global rates help reduce financing costs and also soften commodity prices — a positive for auto manufacturers.
Metals & Commodities
If global growth expectations rise due to Fed easing, metals could see revival.
What Should Indian Investors Do Now?
1. Avoid knee-jerk decisions
Markets may react sharply in the first few sessions, but stability often follows.
2. Focus on strong fundamentals
Companies with resilient earnings, low leverage, and steady cash flows are better positioned to benefit from liquidity-driven rallies.
3. Watch macro indicators
- Dollar Index (DXY)
- US 10-year bond yield
- Indian inflation and RBI commentary
- Crude oil trends
4. Maintain a diversified portfolio
A mix of large caps, sectors with strong earnings visibility, and long-term SIP flows can help ride global cycles smoothly.
FAQs
1. Will the Fed rate cut directly impact Indian interest rates?
Not immediately. The RBI considers domestic inflation and growth, though global cues like Fed policy indirectly influence its stance.
2. Will Nifty rise after the Fed rate cut?
Short-term volatility is possible, but medium-term sentiment tends to be positive due to better liquidity and improved risk appetite.
3. Are FIIs likely to return to Indian markets?
Yes, if global yields remain soft and the dollar cools, India becomes attractive due to strong economic fundamentals.
4. Which sectors will benefit the most?
Banks, NBFCs, real estate, IT, and autos could see improved sentiment depending on secondary macro factors.
5. Should retail investors make changes to their portfolios?
Only after evaluating risk tolerance and goals. Long-term investors should stay disciplined.
Conclusion
The Fed’s move to cut rates to 3.50%–3.75% is a significant turning point for global liquidity and market momentum. For India, the impact is likely to be constructive over the medium term — supported by strong domestic growth, healthy corporate earnings, and robust retail participation.
Investors who balance patience with informed decision-making stand to benefit the most.
If you're looking to analyze markets with expert guidance, real-time insights, and SEBI-registered research support, Swastika Investmart offers a tech-enabled platform to help you invest smarter.
ICICI AMC IPO: Complete Breakdown for Investors : Read This to Know If You Should Apply
Key Takeaways
- ICICI Prudential AMC is launching a ₹10,602 crore 100% OFS IPO.
- Strong financials: EBITDA margin 73%, RoNW 82.8%, consistent growth.
- Diversified AUM and strong brand help maintain stable long-term cash flows.
- Valuation at P/E 40.37x (FY25) seems reasonable vs peers.
- Good for long-term investors; listing gains may be moderate.
ICICI AMC IPO: Complete Breakdown for Investors — Read This to Know If You Should Apply
ICICI Prudential Asset Management Company (ICICI AMC) is finally coming to the public markets, and investor interest is already buzzing. Backed by ICICI Bank and Prudential Group — two respected names in the financial world — this IPO has become one of the most anticipated listings of the year.
In this detailed breakdown, we analyse the company’s business model, strengths, risks, financial performance, valuation, peer comparison, and whether investors should consider applying. This analysis follows SEBI-aligned transparency, Indian market context, and strong research methodology backed by Swastika Investmart’s expertise.
What Does ICICI Prudential AMC Really Do?
ICICI AMC is an Asset Management Company — meaning it manages money on behalf of retail and institutional investors. This money is pooled through mutual fund schemes like:
- Equity funds
- Debt funds
- Hybrid funds
- ETFs and Index funds
- PMS, AIFs
- Offshore advisory mandates
The company’s core responsibility is simple:
Invest clients’ money responsibly and generate long-term returns while managing risk.
They earn revenue primarily from management fees, which are linked to their AUM (Assets Under Management). So, higher AUM → higher income → stable profitability.
As of September 2025, ICICI AMC reported a Quarterly Average AUM of ₹10,147.6 billion, reflecting its large market dominance.
IPO Details
Issue Type: 100% Offer for Sale (OFS)
Total Issue Size: ₹10,602.65 crore
Fresh Issue: NIL
Offer for Sale: ₹10,602.65 crore
Price Band: ₹2061–₹2165
Market Lot: 6 shares
Issue Opens: 12 December 2025
Issue Closes: 16 December 2025
Listing: BSE & NSE
Market Cap at Upper Band: ₹1,07,006.97 crore
Basis of Allotment: 17 Dec 2025
Refunds: 18 Dec 2025
Shares in Demat: 18 Dec 2025
Listing Date: 19 Dec 2025
This IPO is purely OFS — no new money comes into the company, as existing shareholder Prudential Corporation is reducing its stake.
Company Financial Performance (FY23–FY25)
Below is a clean text summary of the company’s consolidated financial performance:
Equity Share Capital
- FY23: ₹17.6 crore
- FY24: ₹17.6 crore
- FY25: ₹17.6 crore
Net Worth
- FY23: ₹2,313.06 crore
- FY24: ₹2,882.84 crore
- FY25: ₹3,516.94 crore
Total Income
- FY23: ₹2,838.18 crore
- FY24: ₹3,761.21 crore
- FY25: ₹4,979.67 crore
EBITDA Margin
- FY23: 73.02%
- FY24: 73.91%
- FY25: 73.04%
Net Profit
- FY23: ₹1,515.78 crore
- FY24: ₹2,049.73 crore
- FY25: ₹2,650.66 crore
Observation:
There is consistent revenue and profit growth, stable margins, strong balance sheet expansion, and market-leading profitability.
Key Strengths of ICICI AMC
1. Strong Brand Backing
ICICI Bank + Prudential Group = instant trust among investors.
2. Diversified Product Mix
Equity, debt, hybrid, ETFs, PMS, AIF — all major asset classes covered.
3. High and Stable Margins
EBITDA margin ~73% indicates superior cost efficiency.
4. Robust Distribution Network
272 offices across 23 states + strong digital onboarding ecosystem.
5. High Return on Net Worth
RoNW of 82.8% is among the best in the financial sector.
Competition & Peer Comparison
Key Interpretation:
ICICI AMC leads the industry in RoNW, revenue scale, and premium brand value.
Outlook & Valuation
ICICI AMC is valued at P/E 40.37x (FY25). While not cheap, the valuation seems justified because:
- High investor trust in ICICI brand
- Strong and predictable fee-driven income
- Massive AUM backing
- Sector tailwinds (financialization of savings)
- Consistent profitability
- Low capital requirements + high operating leverage
Swastika Investmart’s research outlook suggests the IPO is positioned as a long-term compounding opportunity.
Risks to Consider
- 100% OFS — no fresh capital for future expansion
- Regulatory tightening (SEBI norms impact mutual funds)
- High dependence on distributor networks
- Market volatility may affect AUM inflows
- Rising competition from HDFC AMC, Nippon, SBI MF, Axis MF, etc.
Should You Apply for ICICI AMC IPO?
Here’s the balanced view:
Short-Term (Listing Gains)
- Since it is a full OFS, listing pop may be moderate.
- Demand looks strong due to brand name + financial quality.
Long-Term Investors
- Stable business model
- Industry tailwinds
- Strong balance sheet
- High margins and high RoNW
- Brand credibility
Verdict:
If your aim is long-term wealth creation, this IPO is worth considering.
FAQs
1. Is ICICI AMC a debt-free company?
Yes, the company operates with minimal debt due to its asset-light model.
2. What is the biggest risk for mutual fund AMCs?
Regulatory changes from SEBI and market volatility impacting AUM growth.
3. Is the IPO fully OFS?
Yes, 100% OFS, meaning no new shares are issued.
4. What makes ICICI AMC different from competitors?
Its scalable digital ecosystem, massive distribution, and industry-leading RoNW.
5. Can retail investors apply easily?
Yes, through broker apps, UPI, or via Swastika Investmart’s seamless platform.
Conclusion: Should You Apply?
ICICI Prudential AMC stands out for its strong financials, brand backing, diversified product portfolio, and superb profitability metrics. While the IPO is a pure OFS, long-term investors may find significant value as the Indian asset management industry continues to expand with rising financialization.
If you're looking for stability, trust, and steady compounding, ICICI AMC can be a strong addition to your long-term portfolio.


.webp)
.webp)

.webp)


START YOUR INVESTMENT JOURNEY
Get personalized advice from our experts
- Dedicated RM Support
- Smooth and Fast Trading App
