Common Mistakes New Investors Make and How to Avoid Them.


Key Takeaways
- Emotional decisions often lead to poor investment outcomes
- Lack of research and overconfidence can damage long-term returns
- Ignoring diversification increases risk significantly
- A disciplined and informed approach is key to successful investing
Why New Investors Often Struggle
Entering the stock market can feel exciting, especially when you see others making quick profits. But the reality is different. Many new investors end up making avoidable mistakes that hurt their returns.
In India, with increasing participation in markets regulated by the Securities and Exchange Board of India, first-time investors have more access than ever. Yet access without understanding can lead to costly errors.
Let’s look at the most common mistakes and how you can avoid them.
Investing Without a Clear Goal
The Mistake
Many beginners invest without knowing why they are investing. They buy stocks based on trends, tips, or social media hype.
How to Avoid It
Start with a clear objective:
- Wealth creation
- Retirement planning
- Short-term goals
For example, if you are investing for retirement, your strategy will be very different from someone trading for short-term gains.
Following the Herd
The Mistake
Buying stocks just because everyone else is buying is one of the biggest pitfalls. This often leads to entering at high prices and exiting at losses.
How to Avoid It
Do your own research. Understand the business, financials, and future potential before investing.
A stock trending online does not always mean it is fundamentally strong.
Ignoring Diversification
The Mistake
Putting all your money into one or two stocks can be risky. If those stocks underperform, your entire portfolio suffers.
How to Avoid It
Diversify across:
- Sectors
- Asset classes
- Market caps
For instance, combining banking, IT, and FMCG stocks can help balance risk.
Trying to Time the Market
The Mistake
Many new investors try to buy at the lowest price and sell at the highest. In reality, this is extremely difficult, even for experienced investors.
How to Avoid It
Focus on long-term investing. Systematic Investment Plans and regular investing can reduce the impact of market volatility.
Lack of Patience
The Mistake
Expecting quick returns often leads to disappointment. Markets do not move in a straight line.
How to Avoid It
Give your investments time to grow. Wealth creation is a gradual process.
For example, investors who stayed invested during market corrections have historically benefited from long-term growth.
Not Understanding Risk
The Mistake
Many beginners invest without assessing their risk tolerance. This leads to panic during market corrections.
How to Avoid It
Understand your risk appetite before investing. If you are uncomfortable with volatility, consider a balanced approach with both equity and debt.
Overtrading
The Mistake
Frequent buying and selling increases transaction costs and reduces overall returns.
How to Avoid It
Invest with a clear strategy. Avoid unnecessary trades unless there is a strong reason.
Ignoring Financial Ratios and Fundamentals
The Mistake
Investing without analyzing company fundamentals can lead to poor stock selection.
How to Avoid It
Learn basic metrics like:
- Price to Earnings ratio
- Return on Equity
- Debt levels
These indicators help evaluate the quality of a company.
Not Having an Exit Strategy
The Mistake
Many investors know when to buy but not when to sell.
How to Avoid It
Set clear exit rules:
- Target price
- Stop loss
- Change in fundamentals
This helps protect profits and limit losses.
Real-World Example
Consider a new investor who buys a stock based on a tip without research. The stock rises initially, but when it corrects, the investor panics and sells at a loss.
Now compare this with an investor who studies the company, invests gradually, and holds for the long term. The second approach is more likely to generate consistent returns.
Impact on Indian Markets
The rise of retail investors has significantly changed market dynamics. While this increases liquidity, it also brings volatility when decisions are driven by emotions rather than fundamentals.
Regulators like the Securities and Exchange Board of India continue to promote investor awareness and protect market integrity. However, the responsibility of making informed decisions lies with the investor.
Why Guidance Matters
Investing is not just about buying stocks. It is about understanding markets, managing risk, and staying disciplined.
Platforms like Swastika Investmart offer research-backed insights, advanced tools, and strong customer support to help investors make better decisions.
With SEBI-registered services and a focus on investor education, Swastika Investmart helps bridge the gap between information and action.
Frequently Asked Questions
What is the biggest mistake new investors make?
The most common mistake is investing without proper research or clear goals.
Is it safe to follow stock tips?
Relying solely on tips can be risky. It is better to do your own analysis before investing.
How important is diversification?
Diversification helps reduce risk and protects your portfolio from major losses.
Can beginners time the market?
Timing the market consistently is difficult. A long-term approach is more effective.
How can I avoid emotional investing?
Having a clear plan and sticking to it can help reduce emotional decision-making.
Conclusion
Every investor makes mistakes, especially in the beginning. What matters is learning from them and improving your approach.
By setting clear goals, diversifying your portfolio, and staying disciplined, you can avoid common pitfalls and build long-term wealth.
If you are looking to start your investment journey with expert guidance, research-driven insights, and a reliable platform, you can begin here:
Big Budget


.avif)
.avif)
.avif)
.avif)
.avif)


.avif)
.avif)
.avif)
.avif)
Latest Articles

What are Price Patterns?


Price Patterns are shapes or formations on charts that can be categorized and used to predict future price movements.
These patterns have been seen repeatedly across different charts and times, proving their reliability.
- Duration: Price patterns can last from a few days to several months or even years. Longer patterns usually lead to more significant price moves.
- Price Targets: The targets from these patterns estimate how far the price might move, but they are approximate.
- Interpretation: Analysing patterns involves both skill and flexibility. Patterns may not match the textbook description perfectly but can still be valid.
- Considerations: Always look at the price behaviour and the time it takes for the pattern to form to get a complete picture.
Classification of Patterns
Reversal patterns are important signals in trading that suggest a current trend (whether it's going up or down) might soon change direction. They usually appear after a long period of a particular trend. These patterns help traders predict when a trend might be ending and a new one might start.
Common examples of reversal patterns include:
- Head & Shoulders
- Double Top/Double Bottom
- Triple Top/Triple Bottom
- Broadening Formations
- Rounding Bottom/Rounding Top or Cup & Handle Pattern
Continuation patterns are signals in trading that suggest a brief pause in the current trend, but the trend is likely to continue in the same direction after the pause. In other words, the trend takes a short break and then keeps going.
Common examples of continuation patterns include:
- Flags
- Pennants
- Triangles: Ascending Triangle/Descending Triangle
- Rectangles:
Both Continuous and Reversal Patterns

Rising/Falling Wedges
In this blog, we will have a brief look at how these patterns look.
Double Top : A Double Top is a bearish reversal pattern that signals a potential end to an uptrend. It forms when the price creates two high points (highs) at nearly the same level, separated by a period of time.
- Prior Trend: There must be a strong upward trend.
- First High: The price reaches a high point and then pulls back slightly.
- Second High: The price rises again to a similar level as the first high but on lower trading volume.
- Pattern Completion: The pattern is completed when the price drops below the lowest point between the two highs, confirming a trend reversal. This drop should happen with an increase in trading volume.
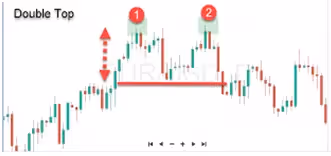
Tip: One will find double top developing often in stocks but one must look at the prior trend and volume to rely on the formation.
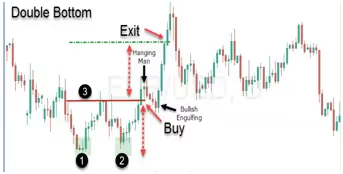
Double Bottom
A Double Bottom pattern is a bullish reversal pattern signalling a potential end to a downtrend.
- Prior Trend: There must be a strong downward trend
- First Low: The price hits a low point (low) and then starts to rise.
- High: After the first low, the price climbs and forms a high point (high), which may look slightly rounded.
- Second Low: The price drops again, creating a second low at a similar level to the first, but with lower trading volume.
- Pattern Completion: The pattern is completed when the price rises above the highest point between the two lows, indicating a reversal of the downtrend. This breakout should occur with increased trading volume.
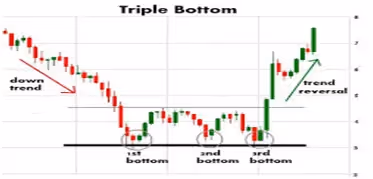
Triple Top
A Triple Top is a bearish reversal pattern that indicates the potential end of an uptrend. It features three distinct high points at roughly the same price level. Here’s a simplified explanation:
- Prior Trend: There must be a strong upward trend before the Triple Top forms.
- Three Highs: The price reaches three highs, each at a similar level, and these highs are well-spaced, marking turning points where the price starts to drop after each high.
- Volume: During the formation of the Triple Top, trading volume usually decreases, with the highest volume at the first high and lower volume on the following highs. However, when the price finally breaks below the support level (the lowest point between the highs), volume should increase, confirming the pattern.

Tip: Pattern is complete when the both lows have been broken on heavier volume.
Triple Bottom
A Triple Bottom is a bullish reversal pattern that signals the potential end of a downtrend. It features three distinct low points at roughly the same price level.
- Prior Trend: There must be a strong downward trend before the Triple Bottom forms.
- Three Lows: The price hits three low points, each at a similar level, and these lows are well-spaced, marking turning points where the price starts to rise after each low.
- Volume: During the formation of the Triple Bottom, trading volume usually decreases, with the highest volume at the first low and lower volume on the following lows. However, when the price finally breaks above the resistance level (the highest point between the lows), volume should increase, confirming the pattern.
Head & Shoulders
- Prior Trend: For a Head & Shoulders pattern to be a reversal signal, there must be a clear uptrend before it forms. Without this uptrend, the pattern can't signal a reversal.
- Left Shoulder: During an uptrend, the price hits a high point (left shoulder) and then drops a bit. This drop usually stays above the trend line, so the uptrend continues.
- Head: After the drop from the left shoulder, the price rises again, reaching a new high (the head). After this high, the price drops again, creating a low point that helps form the neckline.
- Right Shoulder: From the low of the head, the price rises again but doesn’t reach the height of the head. This high (right shoulder) is usually around the same level as the left shoulder. The final decline should break the neckline, completing the pattern.

Inverse Head and Shoulders
The Inverse Head and Shoulders, signals a potential change from a downtrend to an uptrend. Here’s how it forms:
- Prior Trend: There must be a clear downtrend before this pattern can signal a reversal. Without a downtrend, the pattern doesn’t work.
- Left Shoulder: During the downtrend, the price drops to a low point (left shoulder) and then starts to rise.
- Head: After the rise from the left shoulder, the price drops again to a lower point (the head), then rises again, creating a high point that helps form the neckline.
- Right Shoulder: The price drops from the high of the head to form another low (right shoulder). This low should be higher than the head and usually around the same level as the left shoulder. The final rise should break above the neckline, completing the pattern.

When the price breaks above the neckline, it suggests the downtrend may be ending, and the price could start rising.
Broadening Formations
Broadening Formations are patterns where the price creates an expanding triangle. Unlike regular triangles, where the trend lines come together, broadening formations have trend lines that spread out, making the shape of an expanding triangle.
In simple terms, as the price moves, the highs and lows get further apart, creating a pattern that looks like an expanding triangle.
Broadening Bottoms
A Broadening bottom looks like a megaphone and appears during a downtrend. It features:
- Higher Highs and Lower Lows: The price makes progressively higher highs and lower lows, creating a wide, expanding shape over time.
This pattern is a bullish reversal signal, meaning that after it forms, the price trend is likely to shift from down to up.
Volume: Trading volume is often uneven but tends to rise when the price goes up and fall when the price goes down.
Broadening Wedges Ascending
A Broadening Wedges Ascending is a bearish reversal pattern where:
- Trend Lines: Two trend lines slope upwards and get wider apart over time.
- Volume: Trading volume usually increases as the pattern develops.
This pattern indicates that the current uptrend might be ending and a downtrend could begin

Broadening Wedges Descending
A Broadening Wedges Descending is a bullish reversal pattern where:
- Trend Lines: Two trend lines slope downwards and get wider apart over time.
- Volume: Trading volume typically increases as the pattern forms.
This pattern suggests that the downtrend might be ending and a new uptrend could start.

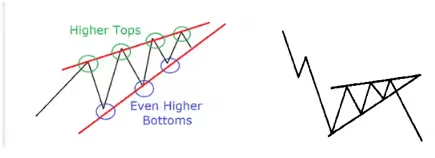
RISING WEDGE
A Rising Wedge is a bearish pattern that forms when prices start wide at the bottom and gradually narrow as they move higher. This pattern slopes upward and signals a potential drop in prices. Here's a simple breakdown:
- Bearish Bias: A rising wedge generally indicates that prices are likely to fall, even though the pattern slopes upward.
- Continuation Pattern: If the wedge forms during a downtrend, it suggests the price might continue to fall after a brief upward movement.
- Reversal Pattern: If the wedge forms during an uptrend, it signals that the upward trend may be ending, and a downward trend could begin.
Regardless of whether it's a continuation or a reversal, a rising wedge usually predicts a drop in prices.
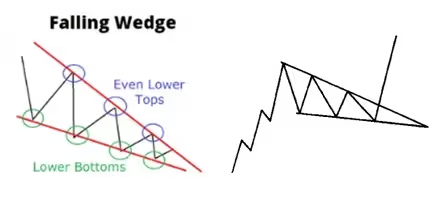
Falling Wedge Pattern
A falling wedge is a chart pattern that looks like a downward-sloping cone. It starts wide at the top and gets narrower as the price moves lower.
- Bullish Signal: It’s considered a bullish pattern, meaning it suggests the price might go up after the pattern forms.
- Continuation Pattern: If the price was going up before the falling wedge, it means the wedge is just a pause, and the uptrend is likely to continue after the pattern completes.
- Reversal Pattern: If the price was going down before the falling wedge, it indicates that the downtrend might end, and the price could start going up.
Overall, whether it’s a continuation or a reversal, a falling wedge generally suggests that prices are likely to rise after the pattern finishes.
Rounding Top
- The price trend slowly curves downward over time, creating a rounded shape.
- Bullish Signal: This pattern is known as a bullish consolidation pattern, which means it suggests that after this gradual downward curve, the price is likely to start moving up

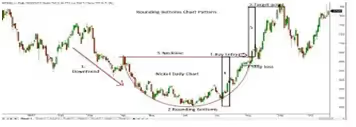
Rounding Bottom
A rounding bottom pattern is a bullish consolidation pattern where the price trend gradually curves upward over time, resembling the shape of a cup. This pattern suggests that the market is slowly gaining strength and is likely to continue rising after the consolidation period.
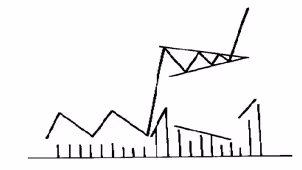
FLAGS & PENNANTS
Flags and Pennants are short-term continuation patterns that show a brief pause in a strong price move before the trend continues in the same direction. These patterns appear after a sharp rise or fall in price with high trading volume.
Flags look like small rectangles that slope against the trend. This pattern looks like a small rectangle that slopes against the main trend. Volume usually decreases during the formation, then picks up again when the price breaks out of the flag.

Pennants have a triangular shape. This pattern looks like a small triangle with converging trend lines and resembles a short symmetrical triangle. Like flags, volume typically decreases during the pattern and increases when the price breaks out.
Both patterns indicate a short break before the price resumes its previous direction, whether up or down.
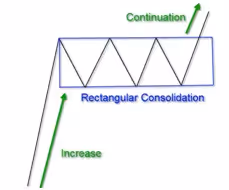
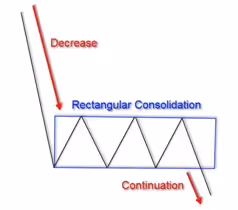
Rectangle
A Rectangle is a continuation pattern that forms when the price moves within a set range during a break in the trend. It looks like a rectangle because the price has two highs and two lows that create parallel lines at the top and bottom.
- Highs and Lows: The price hits similar high points and low points, creating a trading range.
- Other Names: Rectangles are also called trading ranges, consolidation zones, or congestion areas.
This pattern shows that the price is pausing and is likely to continue in the same direction once it breaks out of the range.
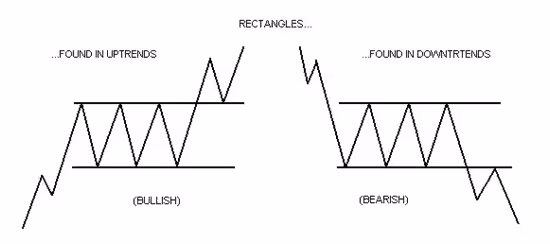
Rectangle Top
Bullish Rectangle Pattern: This is a bullish reversal pattern where the price also moves within a horizontal range, with two horizontal trend lines. When the price breaks above this range, it usually indicates an upward move.
Rectangle Bottom
Bearish Rectangle Pattern: This is a bearish reversal pattern where the price moves within a horizontal range, forming two horizontal trend lines. When the price breaks below this range, it often signals a downward move.
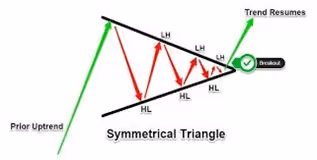
Symmetrical Triangle
A Symmetrical Triangle pattern forms when two trend lines come together and create a triangle shape.
- Upper Trend Line: Slopes downward, connecting lower highs.
- Lower Trend Line: Slopes upward, connecting higher lows.
- Apex: The point (intersection) where the two trend lines meet.
As the triangle forms, trading volume usually decreases. The pattern indicates that the price could break out in either direction when it reaches the apex.
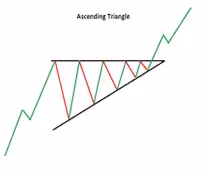
Ascending Triangle
An Ascending Triangle is a bullish pattern that generally forms during an uptrend. It features:
- Horizontal Top Line: A flat line at the top, showing consistent resistance.
- Rising Bottom Line: An upward-sloping line connecting higher lows.
This pattern often signals that the price will keep rising after the triangle forms. It can also appear at the end of a downtrend as a reversal pattern, but it's usually a continuation pattern that shows the price is likely to keep going up.
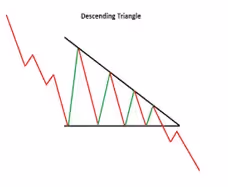
A Descending Triangle is a bearish pattern that usually forms during a downtrend. It has:
- Horizontal Bottom Line: A flat line at the bottom, showing consistent support.
- Downward-Sloping Top Line: A line sloping downwards, connecting lower highs.
This pattern often signals that the price will continue to fall after the triangle forms. It can also appear at the end of an uptrend as a reversal pattern, but it typically indicates the price is likely to keep going down.
Conclusion
Price patterns on charts, whether reversal or continuation, play a vital role in predicting future price movements in the market. Reversal patterns like Double Top, Double Bottom, and Head & Shoulders signal changes in the direction of the current trend, while continuation patterns like Flags, Pennants, and Triangles indicate a brief pause before the trend resumes. Understanding these patterns helps traders make informed decisions about when to enter or exit trades, maximizing potential profits. By analyzing the shape and volume accompanying these patterns, traders can gain insights into market sentiment and anticipate price shifts.
Stay updated with Swastika and learn more about stock market and its terminologies!

Swastika Q1 FY25: Impressive Growth Across All Metrics
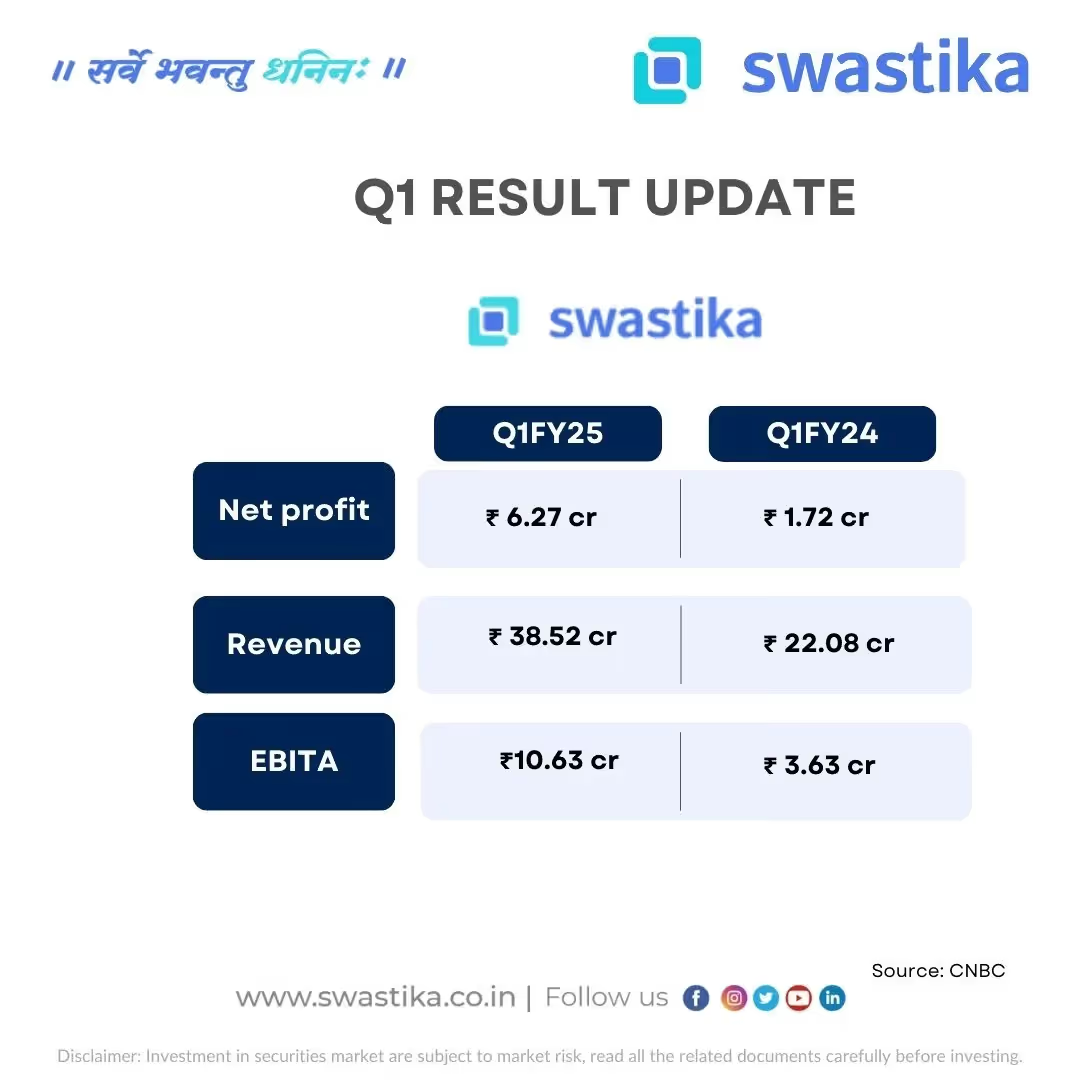
Swastika has reported stellar growth in Q1FY25, with significant improvements in all key financial metrics compared to the same period last year. Here are the highlights:
Key Highlights:
Net Profit: ₹6.27 crore, up from ₹1.72 crore in Q1FY24
Revenue: ₹38.52 crore, a strong increase from ₹22.08 crore
EBITA: ₹10.63 crore, a significant rise from ₹3.63 crore
This impressive performance underscores Swastika's strategic initiatives and strong market position. As we continue to innovate and expand, we remain committed to delivering value to our stakeholders.
Conclusion-
Swastika's Q1FY25 results reflect impressive growth, with substantial increases in net profit, revenue, and EBITA compared to Q1FY24. This performance highlights the effectiveness of the company's strategic initiatives and its strong position in the market. As Swastika continues to innovate and expand, it remains focused on delivering long-term value to its stakeholders, positioning itself for sustained success.
Disclaimer: Investment in the securities market is subject to market risks. Please read all related documents carefully before investing.
Start Trading with Swastika Now!

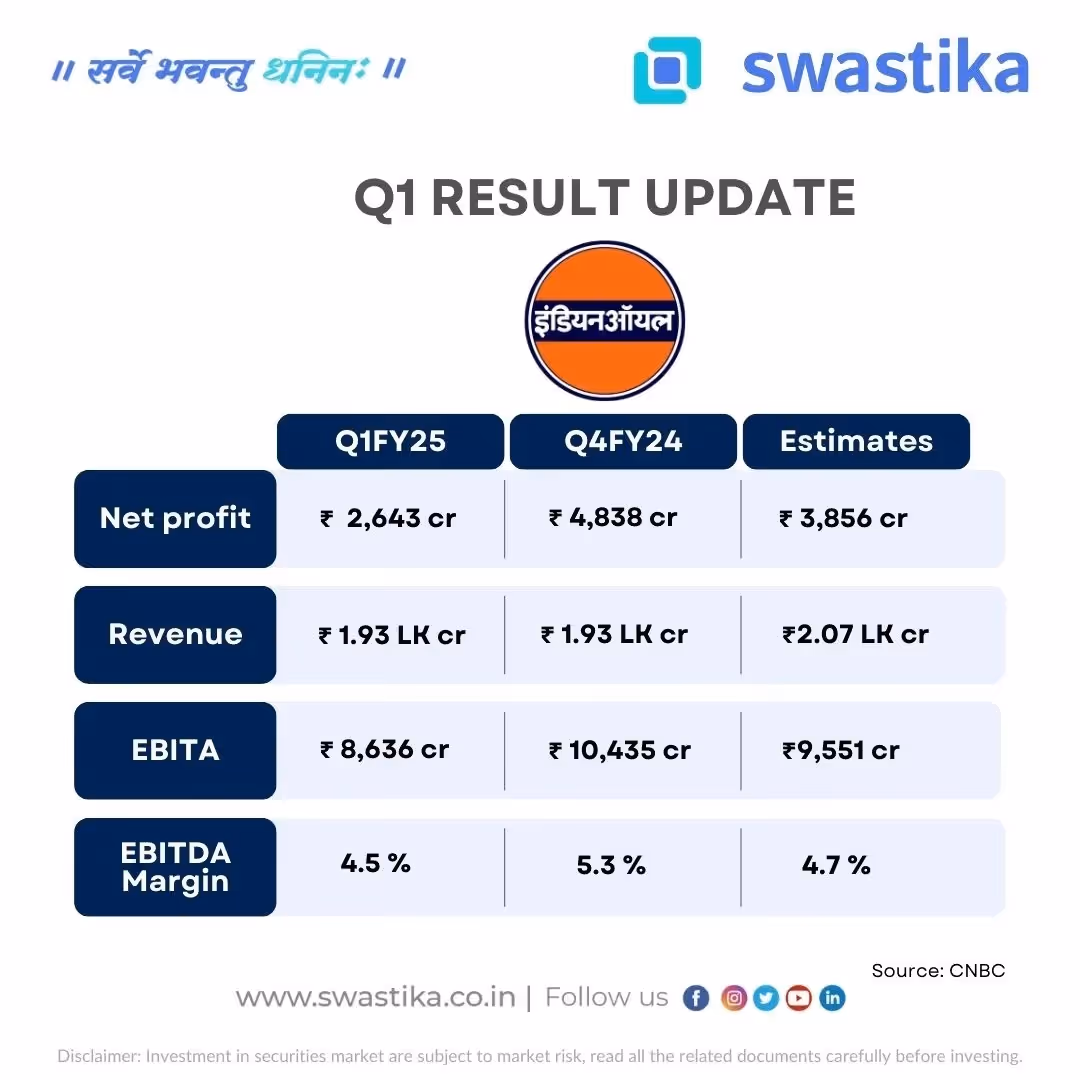
Indian Oil Corporation Limited Q1 FY25 Financial Performance Highlights
Key Highlights
- Net Profit
- Q1 FY25: ₹2,643 crore
- Q4 FY24: ₹4,838 crore
- Estimate: ₹3,856 crore
- Note: The net profit has decreased significantly by ₹2,195 crore compared to Q4 FY24 and is below the estimated profit.
- Revenue:
- Q1 FY25: ₹1.93 lakh crore
- Q4 FY24: ₹1.93 lakh crore
- Estimate: ₹2.07 lakh crore
- Note: Revenue remains consistent with Q4 FY24 but is below the estimated revenue.
- EBITA:
- Q1 FY25: ₹8,636 crore
- Q4 FY24: ₹10,435 crore
- Estimate: ₹9,551 crore
- Note: EBITA has decreased by ₹1,799 crore compared to Q4 FY24 and is also below the estimated EBITA.
- EBITDA Margin:
- Q1 FY25: 4.5%
- Q4 FY24: 5.3%
- Estimate: 4.7%
- Note: The EBITDA margin has declined by 0.8% from Q4 FY24 and is slightly below the estimated margin
Conclusion-
The company’s Q1 FY25 results show a significant decline in net profit, EBITA, and EBITDA margin compared to Q4 FY24, with figures falling below estimates. Although revenue remained consistent with Q4 FY24, it was still lower than the expected amount. The decrease in profitability and margins suggests challenges during the quarter, indicating that the company needs to address these issues to improve its financial performance moving forward.
For more details, visit Swastika's website.
Source: CNBC

Bharat Forge Limited Q1 FY25 Financial Performance Highlights:
- Net Profit:
- Q1 FY25: ₹269.4 crore
- Q1 FY24: ₹315 crore
- Estimate: ₹392 crore
- Note: The net profit has decreased by ₹45.6 crore compared to Q1 FY24 and is below the estimated profit.
- Revenue:
- Q1 FY25: ₹2,338 crore
- Q1 FY24: ₹2,127 crore
- Estimate: ₹2,370 crore
- Note: Revenue has increased by ₹211 crore compared to Q1 FY24 but is slightly below the estimated revenue.
- EBITA:
- Q1 FY25: ₹651 crore
- Q1 FY24: ₹553 crore
- Estimate: ₹650 crore
- Note: EBITA has increased by ₹98 crore compared to Q1 FY24 and meets the estimate.
- EBITDA Margin:
- Q1 FY25: 28%
- Q1 FY24: 26%
- Estimate: 27.6%
- Note: The EBITDA margin has improved by 2% from Q1 FY24 and exceeds the estimated margin
.avif)
For more details, visit Swastika's website.Source: CNBC
.avif)
Bajaj Q1 FY25 Results Update
Bajaj has released its financial results for the first quarter of FY25:
Key Highlights-
Net Profit:
Current Net Profit: ₹1,988 crore
Previous Quarter (Q1 FY24): ₹1,665 crore
Estimated: ₹1,896 crore
Revenue:
Current Revenue: ₹11,928 crore
Previous Quarter (Q1 FY24): ₹10,304 crore
Estimated: ₹11,700 crore
EBIT (Earnings Before Interest and Taxes):
Current EBIT: ₹2,035 crore
Previous Quarter (Q1 FY24): ₹1,954 crore
Estimated: ₹2,360 crore
EBITDA Margin:
Current EBITDA Margin: 20.25%
Previous Quarter (Q1 FY24): 19%
Estimated: 20%
Conclusion-
Bajaj's financial performance for Q1 FY25 shows strong growth compared to the previous quarter, with net profit and revenue both exceeding estimates. The company’s EBIT also showed improvement, though slightly below expectations. The EBITDA margin increased to 20.25%, reflecting operational efficiency. Overall, Bajaj’s results demonstrate solid performance and a positive trend in its financial health, though there is room for improvement in EBIT.
.avif)
Stay updated with Swastika Investmart for more financial insights. JOIN NOW!
.avif)
Infosys Q1 FY25 Results Update
Infosys has released its financial results for the first quarter of FY25.
Key Highlights-
Net Profit:
Current Quarter:₹6,368 crore
Previous Quarter (Q4 FY24): ₹7,975 crore
Estimated: ₹6,198 crore
Revenue:
Current Quarter:₹39,315 crore
Previous Quarter (Q4 FY24): ₹37,923 crore
Estimated: ₹38,905 crore
EBIT (Earnings Before Interest and Taxes):
Current Quarter: ₹8,288 crore
Previous Quarter (Q4 FY24): ₹7,621 crore
Estimated: ₹8,040 crore
EBITDA Margin:
Current Quarter: 21.1%
Previous Quarter (Q4 FY24): 20.1%
Estimated: 20.7%
Conclusion-
Infosys' Q1 FY25 results show a mixed performance. While revenue and EBIT exceeded estimates, net profit fell short of expectations and declined compared to the previous quarter. The EBITDA margin improved to 21.1%, surpassing both the previous quarter and the estimated margin, indicating stronger operational efficiency. Despite the drop in net profit, the company’s overall performance reflects positive growth in key areas, positioning it well for the upcoming quarters.
.avif)
Stay Updated with Swastika for more financial insights. JOIN NOW!


.avif)
.avif)

.avif)


START YOUR INVESTMENT JOURNEY
Get personalized advice from our experts
- Dedicated RM Support
- Smooth and Fast Trading App
