
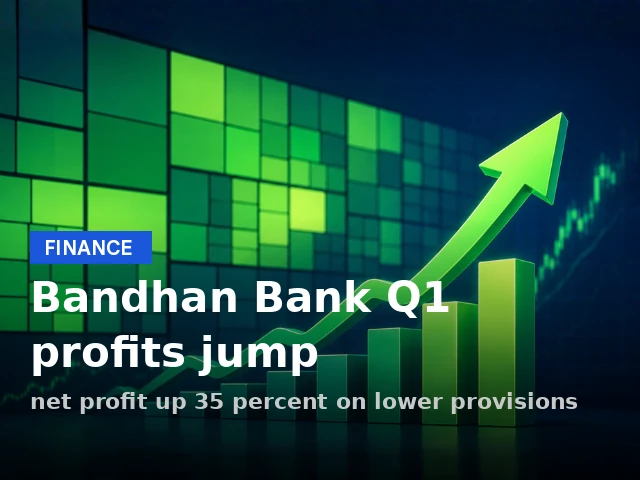
Bandhan Bank Results: Q1 FY26 Profit Jumps 34.9% On Lower Provisions


Key Takeaways
- Bandhan Bank results for Q1 show net profit up 34.9% YoY to Rs 502 crore.
- Net interest income rose 6% YoY to Rs 2,921 crore, with NIM at 6.2%.
- Asset quality improved: GNPA 3.15% and NNPA 0.93%.
- Provisioning declined to Rs 683 crore, enabling stable profitability.
Bandhan Bank results for the June quarter show a sharp profit expansion to Rs 502 crore, up 34.9% YoY from Rs 372 crore a year earlier, according to its regulatory filing. The bandhan bank results reflect cost discipline and improved asset quality. Net interest income (NII) rose 6% YoY to Rs 2,921 crore, while net interest margin (NIM) remained at 6.2% on a sequential basis, underscoring stable core profitability amid tightening credit conditions. Asset quality also improved as GNPA declined to 3.15% from 3.27% in the March quarter, and NNPA eased to 0.93% from 0.97%.
Bandhan Bank Results: Q1 FY26 Profit Jumps 34.9% On Lower Provisions
According to the bank's regulatory filing, the 34.9% YoY rise in profit was driven by lower credit costs. The bank set aside Rs 683 crore in the quarter, significantly lower than Rs 1,147 crore in the year-ago period, though broadly unchanged from Rs 677 crore in the preceding quarter.
| Metric | Value | Comment |
|---|---|---|
| Net Profit (YoY) | Rs 502 crore | Up 34.9% YoY |
| NII | Rs 2,921 crore | Up 6% YoY |
| NIM | 6.2% | Unchanged sequentially |
| GNPA | 3.15% | Down from 3.27% |
| NNPA | 0.93% | Down from 0.97% |
| Provisions | Rs 683 crore | Lower vs Rs 1,147 crore YoY; Rs 677 crore prior quarter |
| Interim CFO | Vinay Jain | Effective Sept 26 |
Analysts note that Bandhan Bank's earnings trajectory remains sensitive to credit costs, even as core profitability holds steady. The improved asset quality reduces the risk of future credit losses and supports sustainable earnings in the near term. Investors should monitor how loan growth, funding costs, and recoveries evolve in the coming quarters to gauge the durability of these gains.
For deeper stock insights, you can explore Swastika's Sarthi AI stock assistant, which offers institutional-grade research on stocks and indices to retail investors.
Frequently Asked Questions
What was Bandhan Bank's standalone net profit in Q1?
Bandhan Bank's standalone net profit rose to Rs 502 crore in the June quarter, up 34.9% from Rs 372 crore a year earlier, per its regulatory filing.
What were Bandhan Bank's net interest income and net interest margin in Q1?
Net interest income stood at Rs 2,921 crore, up 6% YoY, with net interest margin remaining at 6.2% on a sequential basis.
How did Bandhan Bank's asset quality change in Q1?
GNPA eased to 3.15% from 3.27% in the March quarter, and NNPA eased to 0.93% from 0.97%.
What was the provisioning level in Q1, and how does it compare to prior periods?
Provisioning was Rs 683 crore in the quarter, significantly lower than Rs 1,147 crore in the year-ago period and broadly in line with Rs 677 crore in the preceding quarter.
Who was appointed interim CFO at Bandhan Bank?
Vinay Jain was appointed as interim Chief Financial Officer, effective September 26.
Conclusion
Bandhan Bank results point to a healthier credit cost structure and improving asset quality, translating into a steadier earnings base for the quarter. For retail investors, the key takeaway is to watch the trajectory of provisioning and NII in upcoming quarters, as these drivers will determine whether Bandhan Bank can sustain its earnings momentum amid macro headwinds.
Next-step mental model: focus on the quality of growth versus the price of growth. Track NII growth, NIM stability, and any shifts in GNPA/NNPA trends in subsequent quarters, and consider using Swastika's Sarthi AI stock assistant to compare Bandhan Bank with peers and indices as new data arrives.
Open your trading and demat account here
Reference :
1 : Ndtvprofit
Latest Articles

Parsi Dairy Farm Stock Signals Amid Regulation Rumors


Key Takeaways
- Social-media posts claimed Maharashtra FDA suspended Cafe Mysore's licence after inspections, but there is no official confirmation yet.
- Maharashtra FDA has intensified inspections across hotels, restaurants, and roadside eateries since May, under FDA Commissioner Tukaram Mundhe.
- Earlier this week, the FDA suspended the licence of Mumbai-based Parsi Dairy Farm, a related regulatory action cited in discussions.
- Retail investors should wait for official confirmation, assess regulatory risk, and consider applying structured decision-making when tracking parsi dairy farm stock.
Regulatory whispers collided with Mumbai's bustling cafe scene as social-media claims swirled that Cafe Mysore's licence had been suspended. For retail investors watching the dairy sector, this isn't just a local restaurant rumor; it's a test of how regulator signals translate into stock sentiment. In these times, the line between perceived risk and real risk matters for plays like parsi dairy farm stock, a name investors often monitor when dairy-policy headlines trend.
Parsi Dairy Farm Stock Signals Amid Regulation Rumors
Investor attention rarely stays parked on a single restaurant. The broader implication is about regulatory signals and hygiene standards in the dairy-linked consumer space. The social posts claimed the Maharashtra FDA suspended the restaurant's food business licence after a surprise inspection; however, as of publication there is no official confirmation from the regulator. In trading terms, the news cycle functions as a sentiment shock rather than a confirmed event, which is why investors focus on risk indicators and not just headlines. The alleged deficiencies cited in posts include: absence of a protected raw milk reception dock, fungal growth on walls, poor sanitation in production areas, widespread presence of flies, inadequate pest control, no effluent treatment plant, incomplete medical records for food handlers, inadequate protective footwear for workers, missing sanitation records for delivery vehicles, and missing best before/expiry labels on some products.
There is also a human element to the debate: a surgeon who spoke to the restaurant owner described the claims as fake news, asserting the establishment has all valid licenses and has been closed for the past month–well before any regulatory crackdown. While official confirmation remains pending, these anecdotes illustrate how stochastic information can influence retail sentiment around dairy-linked stocks, including parsi dairy farm stock as a conversational touchstone for risk in the sector.
Maharashtra FDA Crackdown: Why Regulators Are Inspecting Mumbai's Food Establishments
The regulatory backdrop matters because it frames the probability of future actions and the potential price impact on dairy-related equities. The Maharashtra FDA intensified inspections after IAS officer Tukaram Mundhe took charge as FDA Commissioner in May. Since then, inspections have spanned several hotels, restaurants, and roadside eateries, with authorities taking actions against establishments found in violation. The objective is consistent: elevate hygiene standards, ensure compliance with licensing terms, and reduce consumer risk. In this context, the broader market question is how such enforcement actions translate into stock risk for dairy-sector players and for hospitality venues connected to food safety standards.
As part of the same regulatory arc, this week the FDA suspended the licence of a Mumbai-based dairy operator named Parsi Dairy Farm, marking a concrete regulatory action within the same ecosystem. This prior action is often cited in market discussions as evidence that regulatory risk can intensify quickly, affecting both sentiment and, potentially, the valuations of similar players in adjacent segments. It is crucial to note that Cafe Mysore's licence status remains officially unconfirmed at the time of reporting; the regulatory picture is still evolving, and investors should watch for formal communiqués from the regulator before pricing in any outcome.
Cafe Mysore Case: What Is Confirmed And What Remains Rumor
From the investor's lens, the absence of official confirmation is itself a signal. Rumors and social-media posts can move sentiment rapidly, but they do not establish regulatory outcomes. The conflicting accounts revolve around the timing of the alleged suspension and whether any licenses beyond the FSSAI (food safety) and state registrations were impacted. The core truth captured by the ongoing coverage is that regulatory bodies have begun more assertive checks after a period of intensified oversight, but a definitive status on Cafe Mysore’s licence was not officially declared in the article’s timeframe. For retail investors, the practical takeaway is to distinguish between rumor-driven volatility and policy-driven risk, especially when the topic touches the dairy and hospitality nexus where consumer-facing brands are under scrutiny.
There is a broader risk management point here: social-media chatter should prompt investors to verify through official channels and to consider how ongoing regulatory actions in Maharashtra may spill over into other urban centers. The difference between a confirmed suspension and a contested rumor can be material for short-term price action, but it should not override the importance of confirmed regulatory communications when evaluating dairy-sector exposure, including parsi dairy farm stock.
Past Precedents: Parsi Dairy Farm Licence Suspension And Its Market Context
In market discussions that connect regulatory signals to stock outcomes, a precedent often cited is the recent suspension of the licence of Mumbai-based Parsi Dairy Farm. While this action is contextually relevant to the dairy industry’s regulatory environment, investors should remember that each case is driven by its own licensing specifics, inspection outcomes, and remediation timelines. The direct link between a regulatory suspension and the stock’s price performance depends on market expectations, the ease of compliance restoration, and the perceived systemic risk to the sector. The Parsi Dairy Farm incident underscores that enforcement can act as a catalyst for shifts in investor sentiment–not as a guaranteed price mover, but as an important risk factor that managers and traders monitor when assessing dairy-sector exposures such as parsi dairy farm stock.
From a portfolio perspective, this precedent suggests a cautious stance: regulatory events can reprice risk quickly, and sectors tied to food safety and regulatory compliance may experience heightened volatility. For a retail investor tracking dairy stocks or hospitality-linked equities, the key is to maintain a watchlist of official statements and to separate fact from speculation in the midst of a crackdown narrative.
Dairy Market Context: How Dairy Prices And Compliance Affect Parsi Dairy Farm Stock Valuations
Beyond a single restaurant incident, dairy-market dynamics–such as price signals for dairy products and products like ghee–affect stock valuations in related segments. In this context, investors should consider parsi dairy farm ghee price as part of the broader dairy-price environment. While regulatory actions don’t directly determine product pricing, they influence operational costs, supply-chain discipline, and brand trust, all of which can shape earnings and multiple expansion for dairy-related stocks. The institutional view is that regulatory risk is a component of the overall risk premium assigned to dairy sector stocks, including parsi dairy farm stock, especially during episodes of heightened enforcement. If regulatory clarity improves, valuations could stabilize; if not, risk premia might persist until the regulatory horizon becomes clearer.
For context, pricing data such as parsi dairy farm ghee price reflect the broader dairy economics that investors monitor. A spike or drift in ghee price could signal changing margins for dairy players and influence the relative attractiveness of stock exposures to the sector. In such a milieu, the interplay between enforcement actions, product pricing dynamics, and consumer confidence becomes a critical equation for investors considering dairy sector exposure, including parsi dairy farm stock.
How Retail Investors Should Decode Social-Media Claims And Regulatory News
In volatile regulatory moments, a disciplined approach helps avoid knee-jerk moves. Here are practical steps for retail investors:
- Separate rumor from official confirmation. Track statements from the Maharashtra FDA or other competent authorities rather than social-media chatter alone.
- Identify the scope of licences affected and the specific violations cited. A broad claim like a blanket suspension requires corroboration across licensing bodies.
- Consider sector-wide risk rather than single-entity risk. If a crackdown is intensifying, many players in the dairy-hospitality axis can experience sentiment shifts, even before any licensing changes.
- Monitor cross-market signals. If Parsi Dairy Farm’s licence is suspended, evaluate how it affects peers and whether a similar enforcement posture could affect other operators in Mumbai or Maharashtra.
- Use institutional-grade research tools to gauge risk and scenario planning. For those who want structured analysis, Swastika's Sarthi AI stock assistant can offer stock-specific insights and help translate regulatory signals into investment decisions.
To navigate such an uncertain information environment, consider a framework that weighs official communications, enforcement momentum, and sector fundamentals. In fast-moving regulatory cycles, patience and verified data trump impulsive trades. If you want a structured, data-driven approach, explore Swastika's Sarthi AI stock assistant for institutional-level research on any stock or index, including dairy sector plays such as parsi dairy farm stock.
Frequently Asked Questions
What is Cafe Mysore's current official licensing status?
As of the latest update, there is no official confirmation from the Maharashtra FDA regarding a suspension of Cafe Mysore's licence; the circulating claims have not been corroborated by regulator statements in the record reviewed.
What actions has the Maharashtra FDA taken recently?
The FDA has intensified inspections after Mundhe took charge as FDA Commissioner in May, targeting hotels, restaurants, and roadside eateries for hygiene and licensing compliance; this week, the regulator suspended the licence of Mumbai-based Parsi Dairy Farm.
How does regulatory risk affect dairy sector stocks like parsi dairy farm stock?
Regulatory risk can influence sentiment and risk premia for dairy-related stocks. Investors typically wait for official confirmations and monitor enforcement momentum, because a regulatory crackdown can shift price dynamics even if a single company’s status remains uncertain.
What happened to the Parsi Dairy Farm licence and why is it relevant?
The FDA suspended the licence of Parsi Dairy Farm earlier in the week, illustrating that enforcement actions can extend beyond a single case and frame how market participants view related dairy operators.
Where can investors access deeper, independent stock research on dairy sector topics?
For institutional-quality insights on stocks and indices, including dairy sector plays, investors can useSwastika's Sarthi AI stock assistant, a tool designed to support due diligence and investment decisions.
Conclusion
The Cafe Mysore controversy illustrates a broader truth about retail investing in the regulatory era: headlines can move sentiment quickly, but official confirmations determine the trajectory. For the dairy sector, regulatory risk remains a meaningful consideration, influencing how investors price risk and allocate capital to stocks like parsi dairy farm stock. The prudent approach is to await formal regulator communications, observe the cadence of enforcement, and maintain a diversified view that accounts for the possibility of continued volatility in both the regulatory and dairy-price environments. In practice, that means building a disciplined watchlist, setting clear risk thresholds, and using robust research tools to translate regulatory signals into actionable decisions. If you want a structured framework to navigate such events, consider leveraging Swastika's Sarthi AI stock assistant to support your ongoing due diligence across stocks and sectors.
Open your trading and demat account here
Reference :
1 : Ndtvprofit

Nse Share Price Insights For Retail Investors: A Swastika Guide
Key Takeaways
- The nse share price is a moving target shaped by demand and liquidity; understand the signal behind the tick.
- This guide breaks down price moves into actionable steps, from tracking to interpretation and risk management.
- Use practical checks and Swastika's Sarthi AI stock assistant to tailor your analysis to stocks like infosys stock price and stock price of tcs.
- Apply a simple framework to decide when to adjust positions and how to build a resilient portfolio.
Nse Share Price Trends: What Retail Investors Should Watch In 110,000/Month Volume
The nse share price moves with the tempo of the market, yet its signals are not random. For a retail investor, understanding the nse share price is less about chasing the latest tick and more about reading the story behind the numbers. Price action is a compact diary of demand, liquidity, and investor sentiment across Indian markets. This Swastika Investmart guide translates the noise into practical steps you can apply, even if you aren’t staring at a trading screen all day. By the end, you’ll know what to watch, how to track movements, and how to decide whether a move is a momentary spike or a meaningful trend.
In plain terms, price is information. When the nse share price moves, it reflects new information entering the market and participants adjusting their expectations. The real skill is learning to separate fleeting volatility from persistent momentum, and then aligning those insights with a disciplined investment plan. If you want an actionable way to translate price data into decisions, you’ll find a repeatable framework here–one that works for a single stock or an entire portfolio.
How To Track The NSE Share Price In Real Time And Make Sense Of It
Tracking the nse share price in real time is not about staring at a single number; it’s about watching the rhythm of the price over short intervals and the context around it. Real-time data feeds provide the last traded price, intraday highs and lows, and the latest traded volume. More important than the tick itself is the rate of change: is the price climbing on increasing volume, or is it sliding on thinning liquidity? The difference can indicate accumulation by buyers, distribution by sellers, or simply intraday noise that may revert later in the session.
To translate price into a decision, establish a habit of comparing two or three common frames: intraday moves (price action within the session), recent trend (last 5–20 trading days), and longer-term context (60–120 trading days). This triad helps you avoid overreacting to a single swing while remaining sensitive to shifts in momentum. If you want a structured approach, start by noting the current nse share price, then check whether recent moves are supported by volume and whether price levels align with your defined risk thresholds. This is where a systematic framework beats impulsive trading every time.
Interpreting The Price Moves Across Major Indian Stocks: Reliance Ind Stock Price, Infosys Stock Price, And TCS
Understanding price moves in big-name stocks helps you gauge the health of broader markets and spot early signals. For instance, the reliance ind stock price often serves as a barometer for the energy and consumer sectors due to its heavy representation in both. When the price rises alongside rising volume, you may be witnessing genuine accumulation from long-term holders or institutions. Conversely, a price dip accompanied by high volume can signal profit-taking or shifts in fundamentals that merit closer inspection.
Similarly, the infosys stock price and the stock price of tcs often act as anchors for the technology sector. A sustained uptick in these megacaps can lift broader sentiment and raise the nse share price, while weakness in these names can spill over into mid and small-cap names. Track not only the direction but the momentum: rising prices with expanding volume often imply stronger conviction than a move on scant liquidity. This distinction matters when you’re deciding whether to add exposure, trim risk, or keep a position for potential mean reversion.
In the same vein, the hdfc bank stock price, icici bank stock, and city union bank stock price movements provide a window into the health of financials. Banks frequently drive the market’s short-term flow because of their sensitivity to policy signals, credit conditions, and macroeconomic data. A rising hdfc bank stock price with healthy credit metrics may reinforce risk-taking in equities, while stress in the banking sector often materializes as caution across sectors. Use these names as references to gauge sector breadth and to test whether a price move is isolated or part of a wider shift in risk appetite.
Turning Price Data Into A Retail Investor Strategy: Step-By-Step
Price data only becomes actionable when translated into a coherent strategy. Here is a practical, four-step approach you can use with any stock or index, including the names discussed above.
- Step 1 – Establish a baseline: Define the price level that represents your acceptable risk and a plausible upside. This baseline should incorporate recent price actions, volatility, and your time horizon.
- Step 2 – Confirm momentum with volume: Look for moves that occur with healthy volume. A price move on thin liquidity may revert, whereas one with rising volume often signals conviction.
- Step 3 – Align with your risk controls: Decide in advance how much you’re willing to lose on a trade from your entry point and set stop-loss levels accordingly. Use position sizing to ensure you’re not overexposed to a single idea.
- Step 4 – Use Sarthi for stock-specific insights: Apply institutional-grade research to refine your thesis on stocks like infosys stock price, stock price of tcs, and others. Swastika's Sarthi AI stock assistant can help tailor insights to your portfolio and watchlist. Swastika's Sarthi AI stock assistant is your bridge between price and decision.
Beyond these steps, adapt your framework to different market regimes. In times of high volatility, you might emphasize tighter risk controls and increased cash allocation. In trending markets, you could widen your price bands to give yourself room for a justified entry or exit. The goal is to keep a simple, repeatable process that can be executed consistently, regardless of market mood.
Related Reads
Frequently Asked Questions
What exactly is the nse share price and how is it determined?
The nse share price is the most recent price at which a security was traded on the NSE. It reflects the latest intersection of supply and demand for that stock during trading hours and is influenced by factors like liquidity, market sentiment, macro news, and company-specific events.
How can I monitor the nse share price in real time as a retail investor?
Retail investors can monitor real-time price data through trusted trading platforms, broker feeds, and market data providers. Look for feeds that show last price, intraday high/low, volume, and bid-ask dynamics to gauge momentum and liquidity.
What factors typically influence NSE share price movements in Indian markets?
Price movements are driven by a combination of macroeconomic indicators, policy changes, sector performance, company earnings, and global market trends. Liquidity, market sentiment, and institutional activity can cause short-term volatility even when fundamentals remain intact.
Which stocks often act as references when evaluating price action in the NSE?
Prominent names like infosys stock price, stock price of tcs, hdfc bank stock price, and reliance ind stock price often serve as reference points because their movement can indicate sector trends and broader market sentiment.
How can Swastika's Sarthi AI stock assistant help with NSE share price analysis?
Swastika's Sarthi AI stock assistant provides institutional-grade research and stock insights that can help retail investors interpret price moves, evaluate risk, and tailor decisions to their watchlists and portfolios.
What practical steps can I take to translate NSE share price data into a trading plan?
Use a simple, repeatable framework: establish a baseline price, confirm momentum with volume, set predefined risk limits, and leverage research tools like Sarthi to refine stock-specific theses before making moves.
Conclusion
The NSE share price is a dynamic signal, not a single point in time. For the retail investor, the value lies in turning price into a plan–recognizing momentum, validating with volume, and anchoring decisions in risk management. Start with a clear baseline, watch for confirming volume, and use a reliable research partner to sharpen your view of price movements on names like infosys stock price and stock price of tcs when building your portfolio. The goal isn’t to predict the next tick but to navigate price action with discipline and a structured framework.
Open your trading and demat account here
Reference :
1 : Ndtvprofit

Kalshi Share Price Insights: World Cup Surge And The Future Of Prediction Markets
Key Takeaways
- 3 million new Kalshi users joined during the 2026 World Cup, and more than $1.2 billion was traded on World Cup winner contracts.
- Kalshi leveraged rapid marketing and partnerships, including OpenAI integration and stadium advertising, to maximize visibility.
- The World Cup surge highlights the potential–and limits–of news-driven trading in prediction markets.
- Indian retail investors should translate these dynamics into disciplined risk management and informed analysis, with tools like Swastika's Sarthi AI stock assistant.
Kalshi Share Price Signals: Why The World Cup Boom Isn’t A Long-Term Trend
Imagine a World Cup where the scoreboard isn’t only about goals, but probabilities you can trade. The 2026 FIFA World Cup unlocked a striking business moment for Kalshi, turning a global event into a living laboratory for retail participation. kalshi share price is a term many watchers use, but in practice Kalshi remains a private company with no public share price to track today. The real signal here is not stock-like price action but the combination of user growth, liquidity, and brand momentum that such events can trigger.
Kalshi added 3 million new users during the World Cup and more than $1.2 billion has been traded on World Cup winner contracts. These figures, disclosed by the company, show the scale of the event-driven demand and set the context for evaluating kalshi share price in a non-public market. Retail investors should interpret these data as a signal of demand, liquidity, and willingness to price outcomes, rather than as a direct measure of a publicly traded instrument. The World Cup moment underscores how global interest can translate into platform activity that mirrors, in intensity, what some investors look for in public markets–without the same ticker-based price signals.
As you parse these numbers, keep in mind that the market environment for Kalshi differs from traditional equities. There is no 'kalshi share price' to monitor on a trading screen; what matters is activity depth, contract pricing, and the ability to convert curiosity into educated participation. For more structured insights, Swastika's Sarthi AI stock assistant can help map these dynamics to different stocks and indices: Swastika's Sarthi AI stock assistant.
Kalshi Platform Growth Through Global Events: The 2026 World Cup Case Study
When a global event with nearly universal attention occurs, the Kalshi platform often shows a corresponding spike in activity. The World Cup 2026 has become a case study in how a news-driven event can draw new users and trigger high-volume trading on event contracts. The growth is not merely about a spike in signups; it is about how a platform uses speed, branding, and relevance to convert fleeting attention into sustained engagement. In this context, the World Cup acts as a live testing ground for platform features that support rapid onboarding and real-time learning for new participants.
Company leadership has underscored speed as a central element of their strategy. Advertising that linked football legends to Kalshi was conceived, produced, and released within 24 hours, a sprint that demonstrates the emphasis on timely relevance. The emphasis on speed helps explain how Kalshi captures the moment when public interest is at its peak, translating it into a broadening user base and higher traded notional. This is not to say these trends guarantee long-term profitability, but they illustrate how a platform can leverage real-world events to accelerate growth trajectories.
According to Tarek Mansour of Kalshi, Our volumes are where the news is at.
Reference :
1 : Ndtvprofit
In the context of brand-building, the World Cup push extended beyond digital channels. Kalshi partnered with ADI PredictStreet, the FIFA World Cup’s official prediction market sponsor, to run co-branded advertising inside stadiums. The company also leveraged public attention by featuring campaigns with high-profile football figures, including Luka Modric and José Mourinho, and the World Cup's infrastructure helped propel visibility. Such partnerships show how a prediction market can embed itself in both online and offline ecosystems, accelerating user acquisition and recognition among diverse audiences. For readers evaluating kalshi share price or the Kalshi platform, this combination of speed and sponsorship ties demonstrates what it takes to build a consumer-friendly product that remains relevant across multiple touchpoints.
OpenAI Integration And Brand Partnerships: How Kalshi Expanded Its Reach
A notable aspect of Kalshi's World Cup initiative was the partnership with OpenAI to display Kalshi contract odds in ChatGPT searches related to World Cup matches. This integration is significant because it places the platform's odds in front of a broad audience that uses AI-assisted search to interpret matches and probabilities. In practical terms, users could encounter Kalshi world cup contract odds directly in an AI-assisted search experience, reducing friction for new participants and potentially improving the accuracy of public perception about event outcomes. The integration is a prime example of how prediction markets can intersect with generative AI to create an educational and practical user journey while reinforcing Kalshi's relevance in real-time decision-making contexts.
From a marketer's perspective, this is a textbook case of turning a familiar event into a multi-channel experience. By aligning with AI-driven search for sports outcomes, Kalshi broadens its funnel beyond traditional finance audiences to include casual fans and curious learners. The World Cup's global reach means more people are exposed to the idea that markets can predict events and that those predictions can have real-world consequences–like payouts from contracts that settle on the event's outcome. For investors evaluating kalshi share price or platform-related signals, the AI-enabled discovery pathway is an example of how a platform can scale its educational and experiential value quickly and efficiently.
What The World Cup Activity Means For Indian Retail Investors Interested In Prediction Markets
The World Cup's reach is global, but retail investors in India can draw several practical lessons from Kalshi's experience. First, event-driven activity can create rapid spikes in user participation and liquidity, but it is essential to separate temporary excitement from sustainable engagement. The fact that 3 million new users joined during the World Cup and that more than $1.2 billion traded on World Cup winner contracts demonstrates that there is demand for accessible, outcome-based trading. However, the sustainability question remains: will these flows persist after the final whistle? The prudent investor will test this by assessing how a platform supports ongoing education, risk management, and transparent pricing rather than chasing a one-off surge.
Frequently Asked Questions
How many new users did Kalshi gain during the World Cup 2026?
Kalshi added 3 million new users during the World Cup 2026.
How much trading occurred on Kalshi's World Cup contracts?
More than $1.2 billion was traded on World Cup winner contracts.
What partnerships did Kalshi announce during the World Cup?
Kalshi partnered with ADI PredictStreet for co-branded stadium advertising and with OpenAI to display Kalshi's contract odds in ChatGPT searches.
Is Kalshi publicly traded and does it have a kalshi share price?
Kalshi operates as a private company, so there is no Kalshi share price publicly available.
What is a practical takeaway for Indian retail investors from Kalshi's World Cup push?
Event-driven activity can boost user growth and liquidity in prediction markets, but sustained engagement and risk education are essential. Consider using credible tools like Swastika's Sarthi AI stock assistant for informed analysis.
Conclusion
By focusing on education, risk management, and credible data, investors can take advantage of the opportunities created by world events while staying aligned with long-term financial goals.
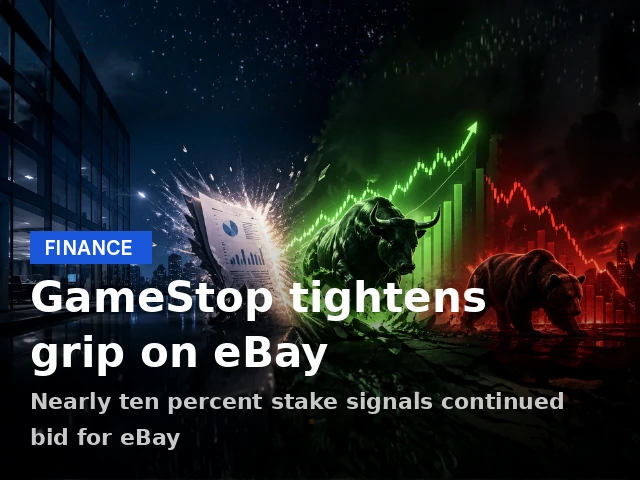
Gamestop Share Price Signals After 9.8% EBay Stake: What Retail Investors Should Watch
Key Takeaways
- GameStop disclosed a 9.8% stake in eBay by converting 43.4 million shares.
- In June, GameStop bought 3.5 million eBay shares for about $381 million and settled another 39 million shares on Friday via put/call trades.
- The implied value of a potential GameStop–eBay combination sits near $56 billion, with financing hinging on TD Securities and an investment-grade rating.
- Cohen signals continued pursuit, stating the team is coming for eBay one way or another.
Late Friday filings disclosed GameStop's stake in eBay has reached 9.8%, amounting to 43.4 million eBay shares. This marks a bold shift in how the market views the two businesses, and the size of the stake instantly raises questions about what a combined company could become in the arena of online marketplaces. For retail investors tracking the gamestop share price, the immediate question is whether this move signals a credible path to a larger strategic play or a tactical positioning within a volatile sector that has already seen rapid changes in leadership and consumer behavior.
To put the numbers on the table, the latest regulatory filing shows 43.4 million eBay shares, translating into roughly a 9.8% stake. This is not a ceremonial position; it reflects a deliberate conversion of earlier economic exposure into actual common stock. The market will watch how this stake translates into influence, governance considerations, and potential paths toward a formal combination that could alter the competitive dynamics of e-commerce, logistics, and consumer marketplaces. In the near term, traders should monitor how the ebay stock price responds to this shift, as sentiment often moves ahead of any official deal announcements.
In June, GameStop pushed the position higher by purchasing 3.5 million eBay shares for about $381 million, expanding its economic exposure as it moves closer to a possible future scenario in which both businesses operate under a more integrated strategy. Friday saw another notable activity: the settlement of about 39 million shares through put/call pair transactions. Taken together with the earlier conversions, these moves solidify a 9.8% stake in eBay and suggest a tactical approach to accumulate economic exposure while the strategic narrative continues to develop.
What does a 9.8% stake mean for the valuation of a potential deal? If the two companies were to merge or align more closely under GameStop leadership, the combined entity has an implied valuation of roughly $56 billion. This is not a guaranteed outcome, but the math signals a substantial potential upside if the strategic fit proves durable and regulatory authorities sign off on the arrangement. For investors, the main takeaway is that any potential premium, synergies, and cross-business opportunities would need to be weighed against financing hurdles and risk factors that could slow progress or cap upside in the near term.
As a reminder of the strategic stakes, the board of GameStop has rejected its earlier takeover proposal. The latest filings and public remarks reiterate a cautious but persistent push from GameStop’s leadership to explore a broader alignment with eBay. In the backdrop, CEO Ryan Cohen has underscored the intent with a direct, provocative line:
This sentiment captures the tension between strategic ambition and the practicalities of financing, governance, and integration risk that accompany any large-scale corporate reorganization.According to Ryan Cohen of GameStop, "I'm not going to call my shots, but we're coming for eBay one way or another."
Reference :
1 : Ndtvprofit
Financing for such a vision is another critical variable. The plan has relied on a non-binding commitment from TD Securities for up to $20 billion in debt, with the overall condition that the combined company secure an investment-grade rating. This financing construct has drawn scrutiny from market observers who caution that debt markets and credit ratings agencies will scrutinize the business case, the execution plan, and the potential for regulatory clearance before any material funding materializes. The combination would require not only a robust commercial rationale but a credible capital structure that aligns with the risk profile of investors and lenders alike.
Beyond the numbers, the corporate actions around GameStop–most notably the approval by shareholders to increase the company’s authorised share count–signal a readiness to deploy greater financial flexibility if a deal moves forward. The practical takeaway for investors is to stay attuned to how management aligns financing, risk, and strategic objectives. And for those who want a structured way to model this evolving landscape, Swastika's Sarthi AI stock assistant offers scenario analysis that can help quantify how different debt outcomes, equity dilutions, and regulatory timelines might affect your portfolio. Swastika's Sarthi AI stock assistant can help you stress-test potential outcomes under a range of price, debt, and regulatory variables.
Ebay Acquisition Implications For Gamestop Investors
The core question for investors looking at the ebay acquisition angle is whether a long-term strategic alignment can translate into tangible value. On one hand, a stronger competitive posture against Amazon could unlock operational efficiencies, cross-brand synergies, and enhanced scale in logistics, payments, and ancillary services. On the other hand, obtaining approval for a major reorganization–especially one that requires large-scale debt financing–depends on a favorable credit backdrop, a predictable regulatory path, and evidence of meaningful cost and revenue synergies that justify the capital allocation. In this context, the ebay stock price reaction to the stake and any subsequent regulatory developments will be a helpful barometer of investor sentiment and perceived strategic fit.
From a risk-management perspective, retail investors should track how market participants price in possible outcomes. If the gamestop share price starts to reflect a probabilistic drag from potential financing constraints or regulatory hurdles, it could imply that the upside is increasingly contingent on external catalysts such as a rating upgrade, a favorable deal structure, or a tangible path to governance alignment. Conversely, any positive movement in ebay stock price alongside a clearer plan for integration could indicate a growing confidence that a combination could deliver durable competitive advantages.
Another reason this story matters for traders is the message it sends about leadership confidence and capital allocation discipline. The $500 million personal capital commitment from Cohen signals a high-conviction stance, while the reliance on non-binding debt commitments underscores the importance of investor confidence in the overall execution plan. For risk-aware investors, this dynamic underscores the need to balance conviction with prudent risk controls and a disciplined approach to position sizing in the context of a highly speculative and high-visibility event.
As this situation unfolds, keep an eye on both ebay stock price moves and any new financing announcements. The path from a 9.8% stake to a fully integrated corporate structure is fraught with complexity, but it’s precisely the kind of strategic scenario that can offers insights into how fast-moving e-commerce and retail ecosystems can evolve. For ongoing research and a structured model of different scenarios, consider using Swastika's Sarthi AI stock assistant to explore best-case, base-case, and worst-case outcomes across multiple dimensions of price, debt, and regulatory probability.
Gamestop Takeover Scenarios In The EBay Context
Looking at the gamestop takeover conversation, it’s useful to think in terms of three potential paths: (1) a friendly, negotiated alignment that unlocks synergies with a favorable financing structure; (2) a contested process requiring governance concessions and regulatory approvals; or (3) a scenario where the stake remains strategic without a formal merger, enabling both sides to pursue standalone growth while leveraging joint opportunities in areas like payments, marketplace services, and cross-border expansion. Each path carries different implications for price, risk, and timeframes, and the market’s reactions will likely reflect evolving signals from the board, the investor base, and potential lenders.
One practical way to assess these paths is to monitor the evolution of the gamestop share price under varying assumptions about financing, regulatory clearance, and strategic alignment. In a base-case scenario where a deal gains traction, the market could assign a premium to eBay’s standalone value and to the potential upside created by a richer combined revenue pool and shared technology platforms. In a more cautious scenario, the lack of immediate financing clarity and continued board opposition could cap upside and keep downside risk anchored in the near term.
In the near term, the narrative hinge remains on three pillars: (a) the strength of the strategic rationale for combining GameStop and eBay; (b) the robustness of the financing plan, especially the ability to secure investment-grade credit and a binding debt package; and (c) the regulatory and governance path to approval. Investors should also watch how consensus sentiment evolves as more details emerge about the possible structure, governance arrangements, and synergies. The path from statement to execution is long, and each milestone–financing commitments, rating upgrades, and board considerations–will move the price dial in meaningful ways.
Financing, Ratings And Board Dynamics: Key Risks In The 9.8% Stake Saga
Financing remains a central risk factor in any credible play toward a GameStop–eBay combination. The plan, as described in the latest filings, relies on a non-binding debt commitment from TD Securities for up to $20 billion, with a critical condition that the combined company secure an investment-grade credit rating. If credit markets tighten or rating agencies push back, the feasibility of a fast-track combination could be compromised, potentially delaying or reshaping the deal terms. In parallel, board dynamics continue to play a crucial role, given the board’s rejection of the prior takeover proposal. The tension between leadership ambition and governance constraints will likely shape market expectations in the weeks ahead.
From a risk-management perspective, investors should monitor how financing conditions plus board positions evolve, as these elements strongly influence the probability of any deal moving forward and the potential premium embedded in the gamestop share price. In all likelihood, market participants will weigh the durability of the strategic thesis against the probability of regulatory hurdles and the time required to build a credible financing package that can withstand rating agency scrutiny.
Practical Investment Tools For Monitoring The 9.8% EBay Stake: A Roadmap For Retail Investors
As retail investors, one of the most actionable steps is to establish a disciplined monitoring framework. Begin with the core data points: the 9.8% stake, 43.4 million shares, the 3.5 million shares purchased in June for about $381 million, and the 39 million shares settled on the latest Friday via put/call trades. Track these figures against movements in ebay stock price, along with any statements from leadership about strategic intent, to gauge whether market expectations are aligning with the evolving story. The market will likely reward clarity on financing timelines and governance considerations, as these are the factors most likely to determine whether a formal agreement can emerge and be sustained.
For investors who want to stay ahead, consider adding structured research tools to your workflow. The Sarthi AI stock assistant can help you build probability-weighted outcomes, calibrate risk budgets, and compare the potential upside of a deal against the downside risks under different financing scenarios. The goal is not to chase headlines but to build a robust framework for decision-making in the face of uncertainty. Swastika's Sarthi AI stock assistant can be a valuable companion in this process.
Frequently Asked Questions
What stake does GameStop hold in eBay as of the latest regulatory filing?
GameStop disclosed a 9.8% stake in eBay by converting 43.4 million eBay shares into common stock.
How many eBay shares did GameStop purchase in June and what was the value?
GameStop purchased 3.5 million eBay shares in June for about $381 million.
What was the latest Friday activity related to GameStop’s eBay stake?
GameStop settled another 39 million eBay shares through put/call pair transactions.
What is the implied valuation for a potential GameStop–eBay combination?
The combination would be valued at roughly $56 billion.
What are the key financing risks for this potential deal?
Financing relies on a non-binding commitment from TD Securities for up to $20 billion in debt and depends on securing an investment-grade credit rating.
Did eBay reject GameStop’s initial offer, and what was the reason?
Yes, eBay rejected the cash-and-stock proposal in May, describing it as neither credible nor attractive.
Conclusion
The 9.8% stake GameStop took in eBay–and the related moves in June and on the Friday trading day–signals a high-stakes strategic pivot rather than a quiet investment. While the board has rejected the initial takeover approach, the combination narrative persists, shaped by ambitious leadership, a sizable capital commitment, and substantial debt financing considerations. For retail investors, the key takeaway is to watch for how financing, governance, and regulatory dynamics interact with price signals from the two stocks. The most practical mental model is to treat this as a probabilistic scenario: assign likelihoods to a spectrum of outcomes–from a negotiated alliance to an extended stalemate–and measure your exposure accordingly.
Next steps for investors are to maintain disciplined risk controls, stay informed about financing progress, and consider using advanced research tools to model the potential range of outcomes. If you want a structured way to monitor this evolving saga and test the impact on your portfolio across different assumptions, Swastika's Sarthi AI stock assistant can be a valuable companion in your decision-making process.
Boeing Stock: How Israel-Iran Tensions Shape The Aerospace Market For Retail Investors
Key Takeaways
- The U.S. has stationed dozens of refuelling aircraft in Israel since Feb. 28.
- As of June 25, 98 U.S. military aircraft were in Israel.
- About 70% of Ben Gurion Airport operations were affected due to resource shifts.
- The region’s developments can influence boeing stock and peers in the near term.
boeing stock is often seen as a barometer of global defense demand, especially when geopolitics flare up and U.S. deployments shift. In the latest developments, the U.S. has stationed dozens of refuelling aircraft in Israel since the conflict began on Feb. 28, with dozens more expected to arrive. Washington has also decided to adjust its force posture in the region, according to the primary source.
As of June 25, 98 U.S. military aircraft were in Israel. These moves reflect a broader pattern: when there is a surge in regional operations, defense contractors with large order backlogs often see outsized demand. This article maps how boeing stock and its peers may react to these dynamics, using the latest official figures to anchor the discussion.
But this narrative is not just about the U.S. and Israel. It also touches the broader supply chain, geopolitics, and procurement cycles across the defense sector. For retail investors, understanding these signals helps to assess risk and opportunity for boeing stock and related names.
In the sections that follow, we translate those headlines into practical investment signals, including how boeing stock interacts with rival names like lockheed martin stock and northrop grumman stock, and what the region’s actions could imply for rtx stock and elbit systems stock price. We also examine elbit systems share price as a regional defense supplier with unique exposure to export cycles.
Boeing Stock Outlook Amid Israel-Iran Tensions And U.S. Refuelling Deployments
According to the primary source, the U.S. has stationed dozens of refuelling aircraft in Israel since the conflict began on Feb. 28. Dozens of additional refuelling aircraft were expected to arrive, signaling a ramp in regional air operations. The Israeli official stated that Washington had decided to adjust its force posture in the region, a move that could sustain or expand air mobility capabilities over the coming months.
As of June 25, 98 U.S. military aircraft were in Israel. These conditions continue to steer defense spending and procurement decisions across major players. For boeing stock, the immediate implication is a potential uptick in orders tied to air mobility platforms, tanker support, and related logistics solutions. Investors should watch for commentary on backlog execution, production schedules, and any shifts in the international order book that could reflect higher demand for bomber, aerial refuelling, and transport missions.
Beyond the U.S.-Israel dynamic, the broader region’s risk posture can influence long-run growth expectations for boeing stock. A sustained risk premium could support defense budgets but also test international sales patience if diplomatic progress slows or if new sanctions alter global procurement patterns. The interplay between geopolitics and defense utilization creates a cycle in which boeing stock may behave like a levered play on defense capex. For context, the next few quarters could reveal whether this scenario translates into durable revenue acceleration or a temporary spike in orders.
Comparing Major Aerospace Stocks: Boeing Stock And Lockheed Martin Stock
Beyond boeing stock, investors frequently compare lockheed martin stock, northrop grumman stock, and rtx stock to gauge exposure to different defense segments such as fighter jets, missiles, and space systems. While boeing stock may benefit from broader air mobility demand, lockheed martin stock has its own scale in advanced fighter programs and long-run backlog geometry. The contrast can offer a more resilient view when one segment underperforms.
In this scenario, the analysis uses the numbers above to frame potential catalysts: the 98 aircraft in Israel as of June 25 and the ongoing tanker deployments. If procurement cycles accelerate, there could be a reallocation of capital toward larger backlogs or higher-margin programs, which could support boeing stock relative to lockheed martin stock. On the other hand, if risk aversion rises or international sales face headwinds, both stocks could correct, highlighting the importance of diversification and risk management.
Investors should also consider northrop grumman stock as a proxy for space and cyber defense growth, alongside rtx stock, which spans integrated defense technology and networking capabilities. The relative strength of these names will depend on new program wins, margins, and the pace of delivery across the global supply chain. For readers who want a broader perspective, the comparative lens helps illustrate how a single regional event can ripple into multiple stock trajectories.
Northrop Grumman Stock And RTX Stock: A Look At The Defense Sector's Runner-Ups
Northrop grumman stock often tracks demand for sensors, stealth systems, and mother platforms used in air and space domains. RTX stock remains a broad defense and technology company with exposure to avionics, engines, and mission systems that may benefit from higher air mobility activity. In the Israeli context, the focus on tanker and airlift operations can indirectly boost demand for spare parts, maintenance services, and mission-ready platforms across the network of contractors supplying the U.S. and allied air forces.
From an investment perspective, the dynamic implies that boeing stock could outperform if the primary drivers are air mobility and logistics, whereas northrop grumman stock and rtx stock could outperform if the emphasis shifts toward space, missiles, and integrated sensing. The relative performance will hinge on the pace of program wins and margins across deals. A broad-sector approach can help you avoid concentrated risk in any single name.
Elbit Systems Stock Price And Elbit Systems Share Price In A Geopolitical Market
Elbit systems stock price and elbit systems share price reflect the exposure of an export-oriented defense contractor to regional conflicts and geopolitical risk. Although Elbit Systems is not a U.S.-centric stock, its price action can provide a contrast to boeing stock and lockheed martin stock because it may react to different demand drivers, including international export licenses and defense spending by allied nations. In a period of heightened regional risk, elbit systems stock price often exhibits sensitivity to orders and deliveries in the Middle East and allied markets.
For retail investors, tracking elbit systems stock price alongside elbit systems share price can provide insight into regional demand dynamics. The stock’s price path may be particularly influenced by near-term export orders, defense budget cycles, and currency fluctuations that affect margins on international contracts. While the numbers in the region may not be identical to the U.S. market, they offer a useful read on how global demand shifts could feed through to boeing stock and other major aerospace names.
Geopolitical Risks, Budgets, And Smart Entry Points For Defence Stock Investors
The current environment underscores the importance of a disciplined approach to defense stock investing. The combination of regional risk, U.S. force posture adjustments, and evolving procurement pipelines can create both opportunities and risks for boeing stock and its peers. Retail investors should monitor defense budget trajectories, potential new deals, and any guidance from management on order backlogs and delivery schedules. An effective approach is to diversify across the sector to capture different streams of demand, including air mobility, missiles, sensors, and space platforms.
In practice, you can use a risk-adjusted framework to evaluate entries in boeing stock and related names. Consider a core position in boeing stock for long-term exposure to air mobility programs, with satellite allocations toward lockheed martin stock, northrop grumman stock, and rtx stock to hedge against sector-specific risks. If you want a deeper, data-driven analysis, Swastika's Sarthi AI stock assistant can help you tailor your stock selection to your risk tolerance and time horizon. Swastika's Sarthi AI stock assistant
Frequently Asked Questions
How many U.S. aircraft were in Israel as of June 25?
As of June 25, 98 U.S. military aircraft were in Israel.
When did the Israel-Iran conflict begin?
The conflict began on Feb. 28.
What percentage of Ben Gurion Airport operations were affected?
About 70% of Ben Gurion Airport operations were affected due to resources shifted to support U.S. military flights.
Where can I get deeper stock analysis for defense stocks?
Swastika's Sarthi AI stock assistant provides tailored stock analysis. https://www.swastika.co.in/sarthi
Which stocks are commonly compared alongside boeing stock in this context?
Investors often compare boeing stock with lockheed martin stock, northrop grumman stock, and RTX stock to gauge exposure across air mobility, space, and missiles.
Conclusion
For retail investors, the Israel-Iran tension narrative translates into a practical test of how defense stocks respond to real-world deployments and procurement signals. The immediate takeaway is not a forecast of war, but a framework for evaluating risk and opportunity in boeing stock and its peers as the region evolves. The next steps are to calibrate exposure to air mobility, backlogs, and international orders, and to use scenario planning to prepare for multi-quarter outcomes.
Open your trading and demat account here
Reference :
1 : Ndtvprofit
Kuwait Stock Price And Gulf Tensions: A Retail Investor's Guide
Key Takeaways
- For retail investors watching the kuwait stock price, geopolitical risk can swing markets in minutes.
- The latest attack on Kuwait's power and water facility shows how quickly supply chains become vulnerable.
- US actions and Iranian warnings raise volatility in gulf stock market and middle east stocks.
- Adopt a risk-aware approach: diversify, monitor data, and consider hedges with actionable research.
On July 19, 2026, at 19:35 IST, a sharp escalation in Gulf tensions unfolded as Kuwait reported a strike on a key power and water plant. For retail investors watching the kuwait stock price, headlines like this matter because risk and liquidity are tied to regional stability. The incident marks the second time in two days that such assets faced attack, with firefighting teams deployed to contain the blaze at parts of the facility. There is no immediate official update on casualties or the extent of damage. The attack comes days after the US bombed a water facility in southern Iran, disrupting drinking water supplies for around 10,000 people. International humanitarian law prohibits deliberate attacks or reprisals against civilian infrastructure.
Analysts watching the gulf stock market will note that geopolitics rarely moves in a straight line. The immediate price action in Kuwait and neighboring markets could reflect risk-off sentiment, while long- horizon fundamentals–such as growth in utilities and infrastructure sectors and the resilience of supply chains–will determine whether the disruption is a temporary blip or a longer-term risk factor for investors. For those tracking the kuwait stock price, today’s headlines underscore why cross-border risk assessment matters more than ever for a retail portfolio with regional exposure.
The incident followed a prior strike earlier in the week, highlighting how quickly tensions can escalate in this corridor. In the context of energy and water infrastructure in the Gulf, such events can ripple into energy prices, utilities equities, and related plays in the gulf stock market. The broader regional impact extends to Middle East stocks that depend on imports, energy flows, and stable governance. This is not just a Kuwait story; it is a Gulf-wide risk signal that highlights the importance of scenario planning for investors who hold exposure to regional equities or global energy-linked assets.
International humanitarian law prohibits deliberate attacks against civilian infrastructure, a reminder that geopolitical risk interacts with human outcomes. In parallel, Arab League Secretary-General Nabil Fahmy warned that the US-Iran confrontation risks deeper violence and urged de-escalation, a memorandum, and a return to negotiations, given the fragile state of maritime navigation through the Strait of Hormuz. These are not procedural notes; they can influence commodity prices, shipping costs, and the appetite for risk across the gulf stock market. Investors should monitor rhetoric, sanctions, and policy shifts that could alter trade flows and energy supply expectations.
In Kuwait, leaders are responding to human costs as well as market pressures. The Kuwaiti Prime Minister visited those injured at Al-Adan Hospital, accompanied by the Health Minister. In the real economy, residents described a shift in daily life: 61-year-old Hassan Rayan said the demand for water and canned goods has increased since this morning amid fears that services or supply chains will be affected; 46-year-old Ali Mahmoud said streets and beaches were almost empty. Such anecdotes underscore how macro events translate into consumer behavior and, in turn, into the near-term dynamics of the gulf stock market. When quantity of water and food supply tightens, consumer and industrial activity can slow, a signal to watch for sectors with domestic demand sensitivity.
Table or chart watchers may look for spikes in trading volumes, shifts in sector leadership, and changes in price-to-earnings multiples for utilities and energy firms. The broader narrative is simple: when infrastructure is targeted or threatened, the risk premium on affected markets rises and market participants reassess exposure across the gulf stock market, the broader Middle East region, and even linked frontier markets. The resilience of the Kuwaiti economy–driven by energy, utilities, and public services–will influence how quickly the kuwait stock price stabilizes after headlines fade. For those seeking deeper, data-driven analysis, Swastika's Sarthi AI stock assistant can help synthesize stock-specific implications across indices and micro-segments. Swastika's Sarthi AI stock assistant helps retail investors gauge institutional-level research on any stock or index.
Kuwait Stock Price Sensitivity Amid Gulf Tensions
The immediate reaction in Kuwait’s equities tends to hinge on how investors interpret risk to civilian infrastructure and energy distribution. When a power and water facility experiences disruption, utilities and related suppliers often witness sharp, short-term moves in price, liquidity, and volatility. The current event–described as the second strike in two days–places a spotlight on the vulnerability of critical infrastructure and how swiftly that translates into price pressure on the kuwait stock price. Investors should watch daily price movements, trading volumes, and sector-specific flows to gauge whether the market is pricing in a longer-term disruption or merely a near-term headline shock. The Ministry of Electricity, Water and Renewable Energy (MEEE) is likely to issue updates that can influence execution risk for utilities players and infrastructure contractors connected to public works. A retail investor with exposure to Kuwaiti utilities or energy-related firms should consider whether the current risk environment warrants defensive repositioning or a temporary hedge while the factual picture clarifies.
The human element cannot be ignored. The market’s interpretation of risk is shaped by what comes next: whether casualties remain unconfirmed, how fast relief and reconstruction efforts proceed, and whether there is external political pressure to de-escalate. The narrative around price movements is not just about Saudi, UAE, or Qatar exposures; it’s about how a single Gulf country’s incident can trigger a cross-border risk repricing that touches the kuwait stock price and, by extension, the gulf stock market. In practical terms, investors should assess how their Kuwait exposure aligns with their overall risk tolerance and liquidity needs. If you hold a position that is sensitive to energy prices or regional supply chains, consider setting a prudent stop or diversifying into non-correlated assets to dampen potential sell-offs.
Gulf Stock Market Reactions And Ripple Across Middle East Stocks
Beyond Kuwait, the gulf stock market often reacts to regional developments that influence energy and infrastructure fundamentals. The latest events come after a day when international actors signaled potential shifts in policy toward civilian infrastructure protection and maritime routes. The ripple effects on middle east stocks can be uneven: energy-centric names might experience heightened volatility, while defensive utilities and consumer-oriented equities could see mixed reaction depending on domestic demand signals and policy responses. For investors, this means watching not only price action but also the sectoral leadership that emerges in the wake of such events. In the short term, risk appetite across gulf stock market respondents can cool as traders price in uncertainty, while longer-term cycles will depend on how quickly reconstruction and stabilization efforts take hold and how external actors reframe risk premia.
Iran stock price is a relevant reference in the broader energy and geopolitical calculus, given ties between regional security and energy flows. The immediate environment suggests a cautious approach to any stock with exposure to energy infrastructure or international logistics. In terms of geographic spillovers, middle east stocks represent a confluence of energy, defense, and consumer demand factors that can shape cross-market correlations for Indian and global investors.
What Indian Retail Investors Should Do Now In The Gulf Market
Retail investors in India with exposure to gulf markets should adopt a structured, data-driven approach to risk management. First, acknowledge that the kuwait stock price and the gulf stock market may exhibit heightened volatility in the near term as the situation evolves. Second, diversify to reduce single-market concentration risk–consider a broader allocation that includes domestic defensive sectors and globally diversified assets. Third, emphasize quality and liquidity in position sizing: prefer companies with strong balance sheets, robust cash flow, and clear business continuity plans that can withstand geopolitical shocks. Fourth, employ hedging strategies where appropriate–such as protective put options or modest cash hedges–to weather sharp drawdowns without abandoning the long-term thesis. Fifth, incoporate macro-condition monitoring, including developments in the Strait of Hormuz, energy price movements, and regional political signals, to adjust risk posture as new facts emerge. Finally, stay informed about official updates from Kuwaiti authorities and regional bodies; sentiment is often driven by the speed and clarity of communication from leadership in times of crisis. If you want a consolidated research aid, Swastika's Sarthi AI stock assistant can help tailor stock ideas to your risk profile and time horizon.
Tracking Kuwait Stock Price And Gulf Indices: Practical Tools And Habits
To interpret today’s headlines into actionable steps, focus on practical tracking signals. Start with the kuwait stock price itself and related gulf stock market indices. Look for intraday price swings, trading volume spikes, and abrupt changes in sector leadership, particularly in utilities and energy. Monitor news flow for updates on casualty figures, Ministry statements, and potential sanctions or de-escalation moves that could alter market sentiment. Cross-check energy prices and shipping costs, including any implications for the Strait of Hormuz, as these factors commonly influence market expectations for this region. The goal is not to chase every move but to identify whether a temporary risk-off phase is forming and whether a longer-term investment thesis remains intact. As always, numerical data such as price levels, volume, and volatility metrics should guide your decisions along with your predefined risk framework.
Iran Stock Price And Its Ripple Effect On Energy And Utilities Sector
While the immediate headlines focus on Kuwait, the broader Middle East risk calculus invites attention to Iran stock price and how regional dynamics may influence cross-border energy and utility exposure. In a scenario where civilian infrastructure and energy supply become more politicized, energy and utilities equities across the gulf region could experience altered multiples and revised risk premia. For a retail investor with a diversified portfolio, the key takeaway is to calibrate exposure to energy-driven equities and consider how correlated or uncorrelated assets behave during a geopolitical shock. Keep an eye on how sanctions, diplomacy, and humanitarian developments unfold in the days ahead, as these can shape the risk-return calculus of Middle East stocks and related markets.
Middle East Stocks And The Way Forward For Retail Investors
The Gulf region sits at the intersection of energy security, maritime routes, and political diplomacy. The current escalation is a reminder that middle east stocks can be sensitive to both regional incidents and international responses. For Indian retail investors, this means maintaining a disciplined approach: emphasize diversification, keep liquidity buffers, and rely on data-driven updates rather than headlines alone. If you are evaluating sector bets, consider which names have robust domestic demand, protective pricing power, or stronger balance sheets that can weather volatility. In such times, a cautious stance–paired with a well-defined exit plan–often reduces downside while preserving upside opportunities in the longer run.
Frequently Asked Questions
What happened in Kuwait's power and water facility?
Iran attacked a power generation and water desalination plant in Kuwait, marking the second time in two days; a blaze erupted and firefighting teams were deployed to contain the fire. There is no immediate official update on casualties or extent of damage.
What is the current status of casualties?
There is no immediate official update on casualties or the extent of damage.
What preceding incident sparked heightened security concerns?
The US bombed a water facility in southern Iran days earlier, disrupting drinking water supplies for around 10,000 people.
What warnings have regional leaders issued?
Arab League Secretary-General Nabil Fahmy warned that the US-Iran confrontation risks deeper violence and urged de-escalation, a return to negotiations, and safe navigation through the Strait of Hormuz.
How has Kuwait's leadership responded locally?
The Kuwaiti Prime Minister visited those injured at Al-Adan Hospital, accompanied by the Health Minister.
What should retail investors watch in the wake of these events?
Investors should monitor the kuwait stock price and gulf stock market responses, look for volatility in utilities and energy, and assess how international developments and humanitarian updates influence risk premiums and market sentiment.
Conclusion
This article was published without a generated conclusion. Please review and add a conclusion before publishing.
Open your trading and demat account here
Reference :
1 : Ndtvprofit
Big Budget


Popular Articles


.avif)
.avif)

.avif)


START YOUR INVESTMENT JOURNEY
Get personalized advice from our experts
- Dedicated RM Support
- Smooth and Fast Trading App
