HDFC Bank Limited - Ex-Date: 19-Jun-2026


Quick Takeaways
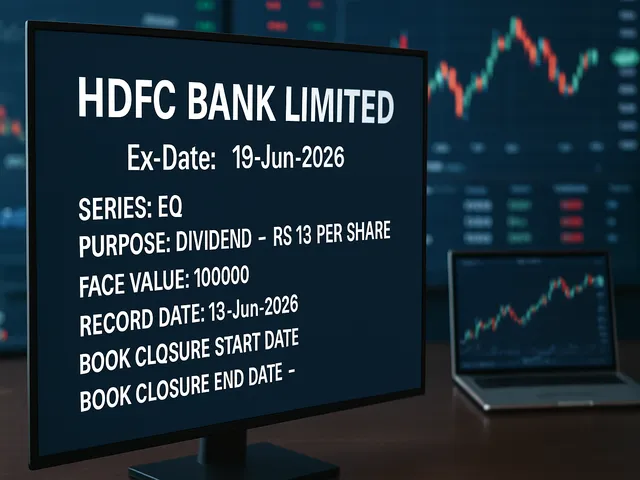
• HDFC Bank announces a Rs 13 per share dividend for the EQ series with ex-date and record date on 19-Jun-2026.
• Ex-date explains eligibility: ownership before 19-Jun-2026 qualifies for the payout.
• Dividend yield depends on the stock price and may affect short-term price movements around the ex-date.
• Book closure dates aren’t specified in the notice; verify timings through official filings and exchanges.
HDFC Bank Dividend Alert: Rs 13 Per Share Ex-Date 19-Jun-2026
Overview of the announcement
HDFC Bank has announced a dividend on its equity shares for the series EQ, with a payout of Rs 13 per share. The ex-date and the record date are both set for 19 June 2026. The notice lists the face value as Rs 100,000 per share, a nominal value used in regulatory filings. No book-closure dates are specified in the notice, so investors should verify the final dates with the exchange or the bank's investor relations portal. This dividend reflects the bank's ongoing practice of returning capital to shareholders at regular intervals, a common feature among large Indian lenders.
What ex-date means and why it matters
Ex-date is the key cutoff for eligibility. If you buy shares on or after the ex-date, you will not receive the declared dividend for this cycle. Those who hold shares before the ex-date qualify for the payout, subject to being registered as a shareholder on the record date. On or around the ex-date, the stock price often adjusts downward to reflect the impending dividend, though market moves can overshadow this adjustment. The record date confirms who is entitled to receive the dividend, and in this case it is 19 June 2026. For investors, understanding these dates helps avoid missing out on expected income and ensures correct settlement timing across brokers and exchanges.
Dividend yield and portfolio impact
The Rs 13 per-share dividend provides a clear income component, but the realized benefit depends on the share price at the ex-date. Yield is calculated as annual dividend divided by the market price, so higher prices reduce the percentage yield and lower prices increase it, all else equal. Remember that total return includes price movement and taxes, not just the dividend amount. This means a stock could deliver a modest dividend but strong price appreciation, or vice versa, influencing overall performance. For those comparing dividend opportunities, it helps to look at historical payout consistency and the longer-term trend in the stock's returns rather than a single payout event.
Yield calculation basics
As a simple illustration, if a share trades around Rs 6,000 and pays Rs 13 in annualized dividend, the nominal yield from this payout is about 0.22% before tax and after price effects are considered. That figure would change with the actual trading price on the ex-date. In practice, many investors weigh such dividends against alternative income options and volatility risk, while also considering how the dividend aligns with their investment horizon and risk profile.
Practical steps for investors
To qualify for the Rs 13 dividend, you should hold HDFC Bank shares before the ex-date of 19 June 2026 and remain registered on the record date. If you acquire shares on or after the ex-date, you would typically miss this payout. Since the notice does not provide book closure dates, it is wise to confirm the exact timeline from official filings or the exchange. Aligning trading plans with corporate actions helps ensure you receive expected income without disrupting other parts of your strategy.
For retail investors, platforms like Swastika Investmart provide research snippets and market updates that help track corporate actions such as dividends. These resources can simplify understanding of when payouts are expected and how to position your portfolio accordingly. By staying informed, investors can avoid missing out on eligible dividends due to timing issues.
It is also worth noting the tax implications of cash dividends. In India, dividend incomes are generally taxable as part of total income, and tax treatment can vary across regimes and years. Investors should consult a tax advisor to understand how the Rs 13 per share payout fits into their personal tax situation and overall investment plan.
Tax considerations and corporate actions
Dividend payments are a form of shareholder value distribution and are distinct from capital gains. Regulatory filings and exchange notices remain the most reliable source for payout timing and any related corporate actions, including changes in capital structure or shareholder registers. Keeping an eye on these sources can help investors adjust expectations and avoid surprises around payout timing or eligibility.
Conclusion
The Rs 13 per share dividend for HDFC Bank, with ex-date and record date lined up for 19 June 2026, provides a defined income event for shareholders. While the headline amount is straightforward, the real takeaways include understanding eligibility, the interaction with stock price on the ex-date, and how this payout fits into a broader investment plan. Staying informed through official channels and reliable market updates supports a disciplined approach to dividend investing.
Frequently Asked Questions
What is the ex-date for HDFC Bank's dividend?
The ex-date is 19 June 2026, which determines who qualifies to receive the Rs 13 per share dividend.
How much dividend is being paid per share?
Rs 13 per equity share for the series EQ.
Why is the record date important?
The record date identifies shareholders who are eligible to receive the dividend; you must be registered as a holder by the record date.
Big Budget


.avif)
.avif)
.avif)
.avif)
.avif)


.avif)
.avif)
.avif)
.avif)
Latest Articles
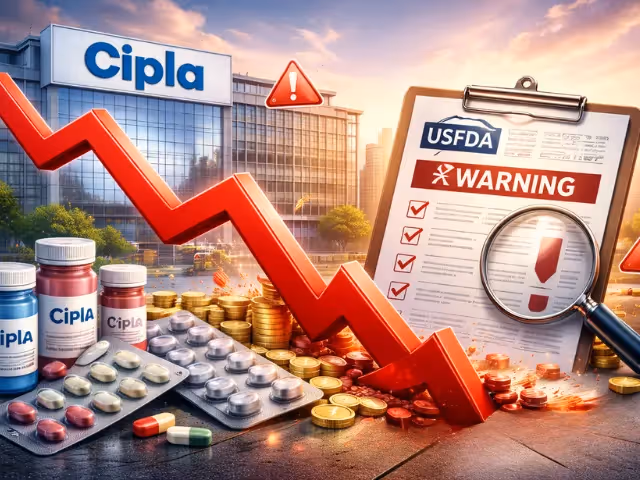
Cipla Shares Slide 5% as USFDA Observations on Key Partner Dent Investor Sentiment


Cipla Shares Slide 5% as USFDA Observations on Key Partner Dent Investor Sentiment
Cipla’s share price came under pressure after reports emerged of USFDA observations issued to one of its key manufacturing partners. The development led to a sharp 5% decline in the stock, reflecting heightened investor sensitivity to regulatory risks in the pharmaceutical sector.
For a company with significant exposure to the US market, regulatory developments often carry outsized importance. While the observations were not directly issued to Cipla itself, the market reaction highlights how closely investors track compliance-related news, especially when it involves overseas regulators like the US Food and Drug Administration.
TL;DR Summary
- Cipla shares fell around 5% following USFDA observations on a key partner facility
- Investor sentiment weakened due to regulatory risk concerns in the US market
- The observations do not imply an immediate ban but require corrective actions
- Indian pharma stocks remain sensitive to US regulatory developments
- Long-term investors are assessing impact on earnings visibility and compliance strength
What Triggered the Fall in Cipla Shares
The stock correction followed disclosures that the USFDA had issued observations after inspecting a facility operated by one of Cipla’s key partners. Such observations typically relate to manufacturing practices, documentation gaps, or process controls, and are communicated through Form 483.
While a Form 483 does not equate to a warning letter or import alert, markets often react swiftly. This is because any delay in resolution can affect product approvals, supply continuity, or revenue timelines, especially in regulated markets like the United States.
In Cipla’s case, the concern stemmed from the partner’s role in supplying products for the US market, which contributes a meaningful share of the company’s overall revenue mix.
Understanding USFDA Observations and Their Market Impact
USFDA inspections are a routine part of pharmaceutical manufacturing, particularly for companies exporting to the US. Observations highlight areas where regulators believe processes can be improved to meet current Good Manufacturing Practices.
Historically, Indian pharma stocks have seen volatility following such developments. Even temporary regulatory uncertainty can influence valuations, as investors factor in the possibility of remediation costs, delayed launches, or lower near-term earnings.
For example, several Indian pharmaceutical companies in the past have faced stock corrections after USFDA observations, only to recover once corrective actions were implemented and compliance was restored. This context helps explain why markets react first and analyze details later.
Cipla’s US Exposure and Investor Concerns
Cipla has built a strong presence in the US generics market over the years, with a diversified product portfolio and steady filings pipeline. The US remains a key growth driver, but it is also the most tightly regulated pharmaceutical market globally.
Investors tend to assess three critical factors when such news breaks. First is the severity of the observations. Second is the track record of the company and its partners in resolving regulatory issues. Third is management communication and transparency.
Cipla has historically maintained a relatively stable compliance record, which may provide some comfort to long-term investors. However, near-term sentiment often remains cautious until clarity emerges on remediation timelines.
Broader Impact on Indian Pharmaceutical Stocks
The reaction in Cipla shares also reflects broader sector dynamics. Indian pharma stocks are highly sensitive to regulatory developments due to their dependence on exports, particularly to the US.
When a large-cap stock like Cipla sees a sharp move, it can influence sentiment across the sector, especially among companies with significant US exposure. This often leads to short-term volatility in pharma indices, even if fundamentals remain intact.
From an Indian market perspective, such events underline the importance of regulatory compliance as a key valuation driver, alongside earnings growth and product pipelines.
What Long-Term Investors Should Track
For long-term investors, the key is to separate short-term sentiment from structural fundamentals. Regulatory observations, while important, are part of the operating landscape for global pharmaceutical companies.
Investors should monitor updates from Cipla regarding corrective actions, engagement with the USFDA, and any potential impact on product approvals or supply schedules. Earnings commentary and regulatory disclosures filed with Indian exchanges also provide valuable insights.
Having access to timely research, expert analysis, and regulatory interpretations can help investors navigate such situations with greater confidence. SEBI-registered platforms like Swastika Investmart offer structured research tools, market insights, and investor education resources designed to support informed decision-making.
Frequently Asked Questions
Why did Cipla shares fall after the USFDA update?
Cipla shares declined due to investor concerns following USFDA observations issued to a key partner facility involved in supplying products for the US market.
Do USFDA observations mean production will stop?
No, observations do not automatically halt production. They indicate areas requiring corrective action and are part of the regulatory review process.
How serious are USFDA Form 483 observations?
The seriousness depends on the nature of the findings. Many companies resolve observations through timely corrective measures without long-term impact.
Does this affect Cipla’s long-term business outlook?
At this stage, the development impacts sentiment more than fundamentals. Long-term outlook depends on resolution timelines and compliance outcomes.
How can investors evaluate regulatory risks better?
By tracking regulatory disclosures, management commentary, and using SEBI-registered research platforms that provide context-driven analysis.
Conclusion
The 5% fall in Cipla shares highlights how regulatory developments, even when indirect, can influence market sentiment in the pharmaceutical sector. While USFDA observations warrant attention, they are not uncommon in global pharma operations and often get resolved with appropriate corrective measures.
For investors, the key lies in staying informed, understanding regulatory processes, and maintaining a long-term perspective. Swastika Investmart, a SEBI-registered brokerage, supports investors with robust research tools, expert insights, tech-enabled platforms, and strong customer support.
If you are looking to track such market-moving developments more effectively or start your investment journey with professional guidance, you can open an account with Swastika Investmart here:

Record Quarter for Tata Steel: Higher Production and Strong Delivery Growth Boost Performance
Record Quarter for Tata Steel: Higher Production and Strong Delivery Growth Boost Performance
India’s steel sector has been navigating volatile global demand, fluctuating raw material costs, and shifting export policies. Against this backdrop, Tata Steel’s latest quarterly performance stands out as a strong operational milestone. Higher production volumes and robust delivery growth across key markets have helped the company post one of its best quarters in recent times, reinforcing confidence in its execution capabilities.
For investors tracking large-cap metal stocks, this record quarter offers valuable insights into how operational efficiency and demand alignment can translate into improved financial performance, even in a challenging macro environment.
TL;DR Summary
- Tata Steel reported a record quarter driven by higher production and strong delivery growth
- Improved capacity utilization and cost control supported operational performance
- Domestic demand remained resilient, aided by infrastructure and manufacturing activity
- Performance has broader implications for the Indian metals sector and market sentiment
- Long-term investors continue to watch balance sheet discipline and global trends
Strong Production Growth Signals Operational Efficiency
One of the most notable highlights of Tata Steel’s quarterly performance was the sharp increase in production volumes. Higher output across Indian operations reflects improved capacity utilization, smoother logistics, and better alignment between demand and supply.
In recent years, steelmakers have focused heavily on operational discipline. For Tata Steel, this meant optimizing blast furnace operations, reducing downtime, and improving raw material sourcing. These efforts appear to have paid off, with production levels reaching new highs during the quarter.
From an investor’s perspective, rising production without a proportional increase in costs is a key positive. It suggests that fixed costs are being spread over higher volumes, which can support margins over time, even if steel prices remain range-bound.
Delivery Growth Reflects Healthy Demand Environment
Alongside production, Tata Steel also reported strong delivery growth. This indicates that higher output was matched by actual market demand rather than inventory build-up.
Domestic deliveries benefited from continued momentum in infrastructure projects, construction activity, and manufacturing demand. Government-led capital expenditure, particularly in roads, railways, and urban infrastructure, continues to support steel consumption across India.
For example, ongoing highway expansion and metro rail projects have sustained demand for long steel products, while automotive and consumer durables segments have supported flat steel demand. Tata Steel’s diversified product portfolio allows it to cater to these segments effectively.
This balance between production and deliveries is crucial. It reflects efficient demand forecasting and reduces the risk of price pressure from excess supply.
Cost Management and Operational Discipline
While production and delivery growth often grab headlines, cost control remains equally important. Tata Steel’s performance suggests continued focus on managing input costs, particularly coking coal and energy expenses.
The company has been investing in backward integration and efficiency improvements to reduce dependence on volatile imports. Over time, these initiatives help stabilize operating margins and protect profitability during commodity downcycles.
In a sector known for earnings volatility, such operational discipline enhances investor confidence. It also aligns with SEBI’s broader emphasis on transparency and sustainable business practices, which long-term investors increasingly value.
Impact on Indian Markets and Metal Stocks
Tata Steel’s record quarter has implications beyond the company itself. As one of India’s largest steel producers, its performance often serves as a bellwether for the broader metal sector.
Positive operational updates tend to improve sentiment across steel and infrastructure-linked stocks. They also reinforce the narrative that domestic demand remains relatively insulated from global slowdowns, supported by India’s growth-oriented policy framework.
From a market context, strong results from a heavyweight stock like Tata Steel can influence benchmark indices and sectoral indices, especially during earnings seasons. For retail and institutional investors alike, such results provide data points to reassess sector exposure.
However, it is equally important to remain balanced. Global steel prices, geopolitical developments, and currency movements continue to pose risks. Investors should view strong quarters as part of a longer business cycle rather than standalone indicators.
What Long-Term Investors Should Watch
While the record quarter is encouraging, long-term investors should continue tracking a few key factors. These include debt reduction progress, capital expenditure plans, and performance of overseas operations, particularly in Europe.
Sustained improvement in return ratios and cash flow generation will be critical for long-term value creation. Monitoring management commentary and regulatory disclosures remains essential, especially in a cyclical sector like metals.
Platforms such as Swastika Investmart provide investors with access to detailed research reports, real-time market insights, and SEBI-registered advisory support, helping them evaluate such developments with clarity and confidence.
Frequently Asked Questions
What drove Tata Steel’s record quarterly performance?
Higher production volumes and strong delivery growth, supported by domestic demand and operational efficiency, were the key drivers.
Does this performance indicate a long-term trend?
It reflects strong execution and demand conditions, but investors should assess it alongside global steel cycles and company fundamentals.
How does Tata Steel’s performance impact the Indian steel sector?
As a sector leader, its results often influence sentiment across metal stocks and highlight demand trends in infrastructure and manufacturing.
Is Tata Steel suitable for long-term investors?
It can be considered by long-term investors who understand commodity cycles and track balance sheet health and global exposure.
How can investors analyze such quarterly results better?
Using structured research tools, expert insights, and regulatory disclosures helps investors make informed decisions.
Conclusion
Tata Steel’s record quarter underscores the importance of operational efficiency, demand alignment, and disciplined execution in navigating a cyclical industry. Higher production and strong delivery growth have not only boosted performance but also reinforced confidence in the company’s strategic direction.
For investors looking to analyze such developments within a broader market framework, having access to reliable research and expert guidance is essential. Swastika Investmart, a SEBI-registered brokerage, combines strong research capabilities, advanced trading platforms, and dedicated customer support to help investors make informed decisions.
If you are planning to start your investment journey or want deeper insights into market-moving developments like this, you can open an account with Swastika Investmart here:
.avif)
Gold Prices Ease as Traders Reassess US-Venezuela Developments
Summary
- Gold prices corrected after recent highs amid geopolitical reassessment
- Stronger US dollar pressured bullion prices
- US-Venezuela developments reduced immediate safe-haven demand
- Indian gold prices remain elevated despite global pullback
- Long-term outlook for gold stays positive amid uncertainty
Gold Prices Ease as Traders Reassess US-Venezuela Developments
Gold prices witnessed a sharp pullback on Wednesday, 7th January 2026, as global markets reassessed recent geopolitical developments involving the United States and Venezuela. After touching levels not seen in over a week, gold retreated as profit-taking emerged and the US dollar strengthened, weighing on bullion prices.
As of mid-session trade, spot gold declined 0.8% to $4,461.51 per ounce, marking a pause after a strong rally that had pushed prices close to record territory in late December 2025.
What Triggered the Fall in Gold Prices
The decline in gold was driven by a combination of geopolitical recalibration and macroeconomic factors rather than a single event.
Reassessment of US-Venezuela Relations
Recent geopolitical developments initially boosted safe-haven demand for gold. However, as clarity began to emerge around diplomatic and strategic moves, traders reassessed the level of risk priced into the metal.
Markets appear to have concluded that immediate escalation risks may be limited, leading to a reduction in defensive positioning.
Stronger US Dollar Pressures Bullion
The US dollar moved closer to multi-week highs during the session, making dollar-denominated assets like gold more expensive for holders of other currencies. Historically, a firmer dollar often creates short-term headwinds for precious metals.
This currency movement played a key role in gold’s intraday decline.
Profit-Taking After a Historic Rally
Gold had surged to record highs of $4,549.71 per ounce in December 2025, driven by geopolitical uncertainty, expectations of interest rate cuts, and sustained investor demand.
After such a rapid rise, some degree of consolidation and profit-booking was inevitable.
US Monetary Policy and Its Influence on Gold
Gold prices remain highly sensitive to expectations around interest rates and liquidity conditions.
Lower interest rate environments tend to support gold, as the opportunity cost of holding non-yielding assets declines. While markets are still pricing in multiple rate cuts later in 2026, policymakers have signaled that future decisions will remain data-dependent.
This balanced outlook has added to near-term volatility in gold prices.
Performance of Other Precious Metals
The correction was not limited to gold alone. Other precious metals also witnessed sharp declines during the session:
- Silver saw a notable drop after recently touching lifetime highs
- Platinum and palladium corrected sharply after strong rallies earlier in the month
These moves suggest broad-based profit-taking across the precious metals complex rather than a shift in long-term fundamentals.
Impact on Gold Prices in India
For Indian investors, global gold price movements directly influence domestic rates, often magnified by currency fluctuations.
Despite the global pullback:
- Gold prices in India continue to trade near elevated levels
- Strong domestic demand and a relatively weak rupee are supporting prices
- Jewellery demand remains resilient ahead of upcoming festive and wedding seasons
As a result, Indian gold prices may not mirror global declines one-to-one and could remain firm in the near term.
What This Means for Indian Investors
Short-Term Perspective
- Expect higher volatility in gold prices
- Sharp intraday swings may continue as markets react to global cues
- Corrections after record highs should not be seen as trend reversals
Long-Term Outlook
- Gold continues to serve as a hedge against geopolitical risk and economic uncertainty
- Central bank accumulation and portfolio diversification demand remain supportive
- Structural factors suggest long-term strength despite intermittent corrections
For Indian portfolios, gold continues to play a strategic role in risk management.
Strategic Role of Gold in 2026 Portfolios
In an environment marked by geopolitical shifts, currency volatility, and evolving interest rate expectations, gold retains its relevance.
Investors are increasingly using:
- Physical gold for long-term wealth preservation
- Gold ETFs for liquidity and transparency
- Digital gold for flexibility and smaller ticket investments
Choosing the right exposure depends on investment horizon and risk appetite.
How Swastika Investmart Helps You Track Commodity Trends
Understanding commodity markets requires timely insights, macro awareness, and disciplined execution.
Swastika Investmart, a SEBI-registered brokerage, supports investors through:
- Daily market and commodity insights
- Research-backed analysis of global and domestic trends
- Technology-driven trading platforms
- Investor education and strong customer support
This enables informed decision-making across asset classes, including precious metals.
👉 Open your trading account today
Frequently Asked Questions
Why did gold prices fall recently?
Gold prices declined due to profit-taking, a stronger US dollar, and reduced immediate safe-haven demand after geopolitical reassessment.
Does the US-Venezuela situation still affect gold prices?
Yes. Any geopolitical development influencing global risk sentiment can impact gold, though markets adjust as clarity improves.
Will gold prices rise again?
While short-term corrections are normal, long-term fundamentals remain supportive due to uncertainty and diversification demand.
How are Indian gold prices impacted by global movements?
Indian prices are influenced by global rates, currency movements, import costs, and domestic demand, often cushioning global declines.
Conclusion: Gold’s Bigger Picture Remains Intact
The recent dip in gold prices reflects market recalibration rather than weakness. After an extraordinary rally, short-term corrections are a healthy part of price discovery.
For Indian investors, gold continues to remain a relevant hedge and portfolio stabiliser in 2026.
If you are looking to invest with research-backed insights, transparent pricing, and a trusted platform, Swastika Investmart offers a comprehensive solution.
👉 Open your trading account today
Stay informed. Stay diversified. Invest with confidence.
%20(2).avif)
Market Opening Price Today: Nifty and Bank Nifty Start Lower on 8th January 2026
Summary
- Indian markets opened slightly lower on 8th January 2026
- Nifty 50 opened at 26,106.50, down 0.13 percent
- Bank Nifty opened at 59,893.15, down 0.16 percent
- Weak global cues and cautious derivative positioning impacted sentiment
- Markets likely to remain range-bound in early trade
Market Opening Price Today: Nifty and Bank Nifty Start Lower on 8th January 2026
Indian equity benchmarks began Thursday, 8th January 2026, on a cautious note as global uncertainty and muted investor sentiment weighed on opening trades. The market opening price today reflects a mild gap-down start, indicating hesitation among traders following mixed global cues and continued FII selling pressure.
While the decline is modest, it signals a wait-and-watch approach ahead of key intraday developments.
Indian Market Opening Snapshot Today
At the opening bell on 8th January 2026:
- Nifty 50 opened at 26,106.50, down 0.13 percent
- Bank Nifty opened at 59,893.15, down 0.16 percent
The opening suggests that markets are digesting overnight global developments while balancing domestic institutional support.
What Is Influencing the Market Opening Today
Global Cues Remain Mixed
US markets closed on a mixed note overnight, with selling pressure visible in select indices. Asian markets traded without clear direction during early hours, which translated into a soft opening for Indian equities today.
FII Selling Versus DII Support
Foreign Institutional Investors continue to pare exposure in Indian equities, especially in index heavyweights. However, steady buying from Domestic Institutional Investors is helping limit downside at the opening.
This tug-of-war is clearly visible in today’s market opening price, where declines remain controlled rather than sharp.
GIFT Nifty Signal
GIFT Nifty traded lower ahead of Indian market hours, accurately signaling a muted start for benchmarks on 8th January 2026.
Sectoral Trends at Market Open
Early trade indicates mixed sectoral performance:
- Banking stocks opened marginally lower, impacting Bank Nifty
- IT stocks remained subdued due to global tech weakness
- Select FMCG and pharma stocks showed early stability
This divergence suggests that stock-specific action may dominate rather than a broad-based market move.
Nifty Technical View After Market Open
From a technical perspective, today’s opening price keeps Nifty within its established consolidation zone.
Key Levels to Track Today
- Immediate support lies near the 26050 zone
- Resistance remains around 26240 and higher near 26350
As long as Nifty holds above key support levels, the downside risk remains limited. A breakout will require sustained buying above resistance during the session.
Bank Nifty Outlook Post Opening
Bank Nifty’s opening near 59,893 confirms ongoing consolidation despite relative strength compared to the broader market.
Bank Nifty Key Levels
- Support zones near 59770 and 59500
- Resistance near 60050 and above
Private banks are likely to provide selective support, while PSU banks may witness intraday volatility.
What This Market Opening Means for Traders and Investors
For intraday traders, today’s market opening price suggests:
- Avoid aggressive directional trades in the first hour
- Focus on confirmation-based setups
- Maintain strict stop-loss discipline
For long-term investors, mild declines at the open should be viewed as part of normal market consolidation rather than a trend reversal.
India’s market structure remains strong under SEBI’s robust regulatory framework, supported by growing retail participation and domestic capital flows.
How Swastika Investmart Helps Navigate Market Openings
Understanding market openings requires more than just price levels. It demands context, data, and disciplined execution.
Swastika Investmart, a SEBI-registered brokerage, empowers traders and investors through:
- Daily market opening and closing insights
- Advanced technical and derivatives research
- Tech-enabled trading platforms
- Strong customer support and investor education
These tools help market participants make informed decisions, even during volatile or uncertain openings.
👉 Open your trading account today
Frequently Asked Questions
Why did the market open lower today?
The market opened lower due to mixed global cues, cautious FII activity, and weak signals from GIFT Nifty.
Is today’s opening a bearish signal?
Not necessarily. The decline is marginal and indicates consolidation rather than a strong bearish trend.
Which index is weaker at the open?
Both Nifty and Bank Nifty opened lower, with Bank Nifty showing slightly higher weakness.
Should traders enter positions immediately after the open?
It is advisable to wait for confirmation and avoid impulsive trades during the first 30 to 45 minutes.
Conclusion: Reading the Market Opening Smartly on 8th January 2026
The market opening price today, 8th January 2026, reflects a cautious start rather than panic. With Nifty and Bank Nifty opening marginally lower, the session is likely to remain range-bound unless fresh triggers emerge.
For traders, patience and discipline remain key. For investors, such openings provide perspective rather than concern.
If you are looking to trade or invest with reliable research, robust platforms, and trusted market expertise, Swastika Investmart offers a comprehensive solution.
👉 Open your trading account today
Stay informed. Trade responsibly. Invest with confidence.
.avif)
Market Set-Up Today: Nifty & Bank Nifty Outlook for 8th January 2026
Summary
- Indian markets open amid mixed global cues on 8th January 2026
- FII selling continues while DII support remains strong
- Nifty trades in a sideways range with rising intraday volatility
- Bank Nifty shows relative strength despite consolidation
- Options data suggests cautious to mildly negative undertone
Market Set-Up Today: Nifty & Bank Nifty Outlook for 8th January 2026
Indian equity markets head into Thursday, 8th January 2026, with a cautious tone as mixed global signals, persistent FII selling, and range-bound technical structures dominate sentiment. While volatility has increased, select pockets continue to attract buying interest, supported by domestic institutional flows.
This market set-up today analysis breaks down global cues, derivative data, technical levels, and what traders and investors should realistically expect from Indian markets during today’s session.
Global Market Cues Setting the Tone Today
Global markets sent mixed signals overnight, which is likely to reflect in Indian equities during early trade today, 8th January 2026.
US markets closed on a mixed note, with the Dow Jones declining sharply, while futures indicate a mildly positive undertone. Asian markets are trading without clear direction, reflecting uncertainty around global growth and interest rate expectations.
Adding to the cautious mood, GIFT Nifty is down by around 65 points, suggesting a soft to flat opening for Indian benchmarks.
For Indian traders, this means stock-specific action may dominate over broad-based directional moves.
FII and DII Activity: A Key Market Driver Today
Institutional flow data remains one of the most important indicators for the market set-up today.
On 8th January 2026:
- Foreign Institutional Investors continue to remain net sellers in the cash market
- Domestic Institutional Investors are providing steady buying support
This divergence explains why markets are not witnessing a sharp breakdown despite consistent selling pressure from overseas investors. Mutual funds, insurance companies, and pension funds continue to support quality stocks, especially in banking, capital goods, and select consumption names.
Derivatives and Options Data Analysis
Derivatives positioning offers crucial insight into near-term market expectations.
Nifty Options and Volatility Snapshot
- Nifty Put Call Ratio remains below the comfort zone, reflecting cautious sentiment
- India VIX is below the 10 mark, but intraday spikes indicate trader nervousness
- Maximum open interest is concentrated near key psychological strikes
This structure indicates that traders are hedging aggressively rather than taking outright bullish bets.
FII Positioning in Index Derivatives
FII activity in index derivatives shows mixed to negative cues:
- Reduction in long futures positions
- Increase in short futures and call writing
- Simultaneous put writing suggests range-bound expectations
This data points toward consolidation with a slight negative bias rather than a trending market.
Nifty Technical Outlook for Today, 8th January 2026
From a technical perspective, Nifty continues to trade in a sideways band with increased intraday volatility.
Key Nifty Levels to Watch Today
- Strong support zone lies between 26050 to 25970, where buyers are likely to emerge
- Immediate resistance levels are placed near 26240 and 26350
As long as Nifty holds above the demand zone, sharp sell-offs may be limited. However, a sustained move above resistance will be required for any meaningful upside.
For intraday traders, today’s market set-up favors range-based strategies rather than aggressive directional trades.
Bank Nifty Outlook: Relative Strength Continues
Bank Nifty continues to outperform the broader market on a relative basis, even as it consolidates.
Bank Nifty Key Levels for Today
- Immediate support is seen near 59770 and 59500
- Resistance levels are placed around 60050, 60300, and 60600
Private sector banks and select PSU banks are witnessing accumulation at lower levels, supported by stable asset quality expectations and controlled credit risk.
For traders, Bank Nifty remains a better candidate for stock-specific and spread strategies rather than naked positions.
How Today’s Market Set-Up Impacts Indian Investors
For retail investors and long-term participants, the market environment on 8th January 2026 offers important takeaways.
Short-term volatility should not distract from the broader structural story of Indian markets. Regulatory stability under SEBI, improving corporate balance sheets, and strong domestic participation continue to provide long-term confidence.
However, traders must respect risk management strictly, as sudden global cues can lead to sharp intraday swings.
Why Many Traders Rely on Swastika Investmart’s Market Insights
In volatile and range-bound markets like today, quality research and timely execution matter more than ever.
Swastika Investmart, a SEBI-registered brokerage, offers:
- In-depth daily market set-up reports
- Strong derivatives and options analytics
- Technology-driven trading platforms
- Dedicated customer support and investor education initiatives
This combination helps traders and investors navigate uncertain markets with discipline rather than emotion.
👉 Open your trading account today
Frequently Asked Questions
Is today a good day for intraday trading?
Yes, but only with strict stop-losses. Range-bound conditions favor disciplined intraday strategies.
What is the trend for Nifty today?
The trend remains sideways with a slight negative bias unless resistance levels are decisively broken.
Are FIIs still selling Indian markets?
Yes, FIIs continue to sell in the cash market, while DIIs are absorbing the supply.
Which index looks stronger today?
Bank Nifty is showing relatively better strength compared to Nifty.
Should long-term investors worry about current volatility?
No. Long-term investors should focus on fundamentally strong stocks and ignore short-term noise.
Conclusion: Navigating the Market Smartly on 8th January 2026
The market set-up today, 8th January 2026, reflects a phase of consolidation rather than panic. Mixed global cues, cautious FII positioning, and stable domestic support are keeping Indian markets range-bound.
For traders, patience and discipline are essential. For investors, this phase offers an opportunity to accumulate quality stocks gradually.
If you are looking for structured research, reliable execution, and investor-focused services, Swastika Investmart provides a trusted platform backed by SEBI registration and years of market expertise.
👉 Open your trading account today
Stay informed. Trade responsibly. Invest with confidence.

Titan Hits Record Highs: Shares Jump 4% After Robust Q3 Performance Across Categories
Key takeaways
- Titan shares surged nearly 4 percent to fresh lifetime highs after Q3 results
- Jewellery, watches, and eyewear segments delivered broad based growth
- Strong festive demand and premiumisation trends boosted performance
- The results reinforced Titan’s leadership position in the Indian consumer space
Titan’s Q3 Performance Sends Shares to Record Highs
Titan Company shares touched record highs after the company reported a robust performance for the third quarter, driven by strong demand across its core business segments. The stock reacted positively as investors digested consistent growth in jewellery, steady momentum in watches, and improving traction in eyewear.
The rally reflects not just a strong quarter but confidence in Titan’s long term business model, brand strength, and execution capabilities in a competitive consumer market.
What Drove Titan’s Strong Q3 Performance?
Titan’s Q3 performance stood out due to its balanced contribution from multiple categories rather than dependence on a single segment.
Jewellery Business Continues to Shine
The jewellery segment, led by the Tanishq brand, once again played a pivotal role. Festive season demand, wedding purchases, and rising preference for organised players supported strong growth.
Higher gold prices did not dampen demand as consumers increasingly prioritised trust, purity assurance, and design innovation. This trend continues to favour established brands like Titan over unorganised jewellers.
Watches Segment Shows Steady Recovery
Titan’s watches business delivered steady growth, supported by premiumisation and strong demand for smart and lifestyle watches. Brands such as Titan, Fastrack, and Sonata benefited from improved discretionary spending.
The segment’s recovery also highlights changing consumer behaviour, where watches are increasingly viewed as lifestyle accessories rather than utility products.
Eyewear and Emerging Categories Gain Momentum
Titan EyePlus posted improved performance as store additions and better product mix contributed to growth. While still a smaller contributor to overall revenue, eyewear remains a long term opportunity aligned with rising health awareness and urban consumption trends.
Emerging categories like wearables and international brands also added incremental value during the quarter.
Why the Market Reacted Positively
The nearly 4 percent jump in Titan shares was driven by a combination of numbers and narrative.
Consistency Over Cycles
Investors value companies that deliver consistent performance across economic cycles. Titan has demonstrated resilience during periods of inflation, volatile gold prices, and changing consumer sentiment.
The Q3 results reinforced confidence that Titan can navigate short term challenges without compromising long term growth.
Margin Discipline and Cost Control
Despite input cost pressures, Titan maintained healthy margins through efficient sourcing, pricing strategies, and scale advantages. This discipline reassured investors concerned about profitability in a high cost environment.
Leadership in Organised Retail
Titan continues to gain market share as consumers shift from unorganised to organised retail. Regulatory oversight, GST compliance, and transparency have accelerated this transition, benefiting trusted brands.
Broader Impact on Indian Equity Markets
Titan’s performance carries significance beyond a single stock.
Positive Signal for Consumption Theme
Strong results from a leading consumer discretionary company suggest that urban consumption remains resilient. This has positive implications for other retail, lifestyle, and discretionary stocks.
Reinforces Quality Stock Preference
Indian markets have increasingly rewarded companies with strong balance sheets, brand equity, and governance standards. Titan’s rally reflects this preference for quality over speculative growth.
FII and Institutional Interest
Large cap consumer names often attract foreign institutional investors during periods of global uncertainty. Titan’s stable earnings profile makes it a preferred play within the India growth story.
What Investors Should Watch Going Forward
While the outlook remains constructive, investors should track a few key factors.
Gold Price Volatility
Sharp movements in gold prices can impact near term demand patterns. However, Titan’s ability to pass on costs and manage inventory reduces long term risk.
Expansion and Store Additions
Titan’s growth strategy relies on expanding its retail footprint across Tier II and Tier III cities. Execution and return on capital will remain important metrics.
Competitive Landscape
Competition from both organised and digital players is increasing. Titan’s continued investment in design, customer experience, and technology will be crucial.
How Swastika Investmart Helps Investors Track Quality Stocks
Tracking high quality companies like Titan requires more than headline numbers.
Swastika Investmart, a SEBI registered brokerage, supports investors through:
• In depth fundamental research on consumer and retail stocks
• Technology driven platforms for real time market tracking
• Dedicated customer support for retail and long term investors
• Investor education programs focused on wealth creation
Rather than reacting to short term price movements, informed investing backed by research makes the difference.
Frequently Asked Questions
Why did Titan shares hit record highs after Q3 results?
Titan delivered strong performance across jewellery, watches, and eyewear segments, boosting investor confidence in its growth outlook.
Which segment contributed the most to Titan’s Q3 growth?
The jewellery segment remained the largest contributor, supported by festive demand and premiumisation trends.
Does rising gold price affect Titan’s business?
Short term demand may fluctuate, but Titan’s brand strength and pricing power help manage long term impact.
Is Titan considered a long term consumer stock?
Titan is widely viewed as a long term play on India’s organised retail and rising consumption theme.
What should investors monitor next?
Investors should track margin trends, store expansion, and demand conditions in upcoming quarters.
Conclusion: Titan’s Growth Story Remains Intact
Titan’s record high after Q3 results reflects strong execution, brand leadership, and sustained demand across categories. The performance reinforces why Titan remains a benchmark stock in India’s consumer discretionary space.
For investors seeking exposure to quality companies with consistent growth and strong governance, disciplined research and the right investing partner matter.
Explore smarter investing opportunities with Swastika Investmart.


.avif)
.avif)

.avif)


START YOUR INVESTMENT JOURNEY
Get personalized advice from our experts
- Dedicated RM Support
- Smooth and Fast Trading App
