From Inflation to Bond Yields: Understanding Interest Rate Cycles & Market Impact.


Key Takeaways
- Inflation directly influences interest rate decisions by central banks
- Rising inflation pushes bond yields higher and impacts equity valuations
- Interest rate cycles affect different sectors in different ways
- Bond markets react faster than equities to macro changes
- Smart asset allocation helps investors navigate these cycles
Introduction
If you have ever wondered why markets suddenly turn volatile or why borrowing costs change, the answer often lies in three interconnected factors: inflation, bond yields, and interest rate cycles.
At the center of this ecosystem is the Reserve Bank of India, which adjusts policy rates to balance growth and inflation. These decisions ripple through bond markets, equity markets, and ultimately your investment portfolio.
Understanding this chain reaction is essential for investors who want to stay ahead rather than react late.
What is Inflation and Why It Matters
Inflation refers to the rise in prices of goods and services over time. While moderate inflation is a sign of healthy demand, excessive inflation can disrupt economic stability.
Real-World Example
When fuel prices increase, transportation costs go up. This affects everything from groceries to manufacturing. As a result, consumers end up paying more across categories.
👉 This is how inflation spreads across the economy
How Inflation Impacts Interest Rates
Central banks use interest rates as a tool to control inflation.
When Inflation Rises
- Central bank increases interest rates
- Borrowing becomes expensive
- Demand slows down
When Inflation Falls
- Central bank cuts interest rates
- Borrowing becomes cheaper
- Consumption and investment rise
The Policy Role
The Reserve Bank of India closely tracks inflation trends before making policy decisions. Its primary goal is to maintain price stability while supporting growth.
Understanding Interest Rate Cycles
Interest rate cycles move in phases depending on economic conditions.
📉 Easing Phase
- Rates are reduced
- Liquidity increases
- Equity markets tend to perform well
📈 Tightening Phase
- Rates are increased
- Liquidity tightens
- Market valuations may compress
⏸️ Pause Phase
- Rates remain unchanged
- Markets turn data-dependent
- Volatility can remain high
Bond Yields: The Missing Link
Bond yields are often the first indicators of changing economic conditions.
What Are Bond Yields?
Bond yield is the return an investor earns on a bond.
Relationship Between Inflation and Bond Yields
- Rising inflation leads to higher bond yields
- Falling inflation leads to lower bond yields
👉 Key Rule:
When yields rise, bond prices fall, and vice versa
Why Bond Markets React First
Bond investors closely monitor:
- Inflation data
- Interest rate expectations
- Fiscal policies
👉 This makes bond markets more sensitive and quicker to react than equity markets
Impact on Equity Markets
Equity markets respond differently depending on the stage of the cycle.
🔴 High Inflation and Rising Rates
- Valuations come under pressure
- Growth stocks may correct
- Cost-sensitive sectors struggle
🟢 Stable Inflation and Lower Rates
- Earnings visibility improves
- Liquidity supports valuations
- Market sentiment turns positive
Sector-Wise Impact in India
🚀 Beneficiaries
- Banking sector during rising rates
- Commodities and energy during inflation spikes
⚠️ Challenged Sectors
- Real estate and auto due to higher borrowing costs
- FMCG due to input cost pressures
Practical Example from Indian Markets
During periods of rising inflation in India, bond yields have historically moved higher, leading to cautious equity market behavior. Rate-sensitive sectors such as real estate and auto often underperform, while banks may benefit from improved margins.
This pattern reinforces the importance of tracking macro indicators rather than focusing only on stock-specific news.
How Investors Should Respond
Understanding macro cycles can significantly improve investment decisions.
🧠 1. Focus on Asset Allocation
Balance between equity, debt, and other assets
📊 2. Track Bond Yields
They often signal upcoming changes in interest rates
📉 3. Adjust Sector Exposure
Reduce exposure to rate-sensitive sectors during tightening phases
⏳ 4. Stay Long-Term Focused
Short-term volatility is part of market cycles
Why This Matters More Today
With global uncertainties, commodity price fluctuations, and changing inflation trends, interest rate cycles have become more dynamic.
For Indian investors, this means:
- More frequent market shifts
- Greater importance of macro awareness
- Need for disciplined investing
FAQs
1. What is the relationship between inflation and bond yields?
Rising inflation usually leads to higher bond yields, while falling inflation leads to lower yields.
2. How do interest rate cycles affect stock markets?
Rate hikes can pressure valuations, while rate cuts generally support market growth.
3. Why do bond markets react faster than equity markets?
Bond markets are more sensitive to macroeconomic changes like inflation and interest rates.
4. Which sectors perform well during rising interest rates?
Banking and financial sectors may benefit, while rate-sensitive sectors may struggle.
5. How should investors use this information?
Investors should track macro indicators, diversify their portfolios, and adjust strategies based on economic cycles.
Conclusion
From inflation to bond yields and interest rate cycles, the connection is clear. These factors shape market direction and influence investment outcomes more than short-term news flows.
For investors, the goal is not to predict every move but to understand the cycle and position accordingly.
At Swastika Investmart, we combine deep market research, advanced tools, and investor education to help you navigate complex market environments with confidence.
Big Budget


.webp)
.webp)
.webp)
.webp)
.webp)


.webp)
.webp)
.webp)
.webp)
Latest Articles
Should You Apply for Groww IPO? Expert View & Key Highlights


Key Takeaways
- Groww IPO opens from November 4 to November 7, 2025
- Price band: ₹95–₹100 per share; issue size around ₹6,632 crore
- Strong user base and 26%+ market share in online investing
- FY24 dip due to one-time accounting adjustment, not weak fundamentals
- Fair valuation — suitable for medium to long-term investors
From Startup to Stock Market: Groww’s Inspiring Journey
“Ek time tha jab investing sirf experts ka game mana jaata tha…” — but Groww changed that forever.
Founded in 2017, this Bengaluru-based fintech turned millions of first-time investors into confident wealth creators through its simple app interface and easy-to-understand investing tools. Within just a few years, Groww emerged as one of India’s fastest-growing digital investment platforms, capturing over 26% of the mutual fund distribution market.
And now, it’s stepping into a new league — the Indian stock market, with its much-awaited Groww IPO opening between November 4 and November 7, 2025.
GROWW IPO Timeline:
Groww’s IPO is a mix of fresh issue and offer-for-sale (OFS), aimed at expanding technology infrastructure, enhancing financial literacy initiatives, and meeting regulatory capital requirements.
Financial Performance: The Numbers Tell a Strong Story
Groww has showcased impressive growth in user acquisition, AUM (Assets Under Management), and revenue since its inception. The company’s financials reveal a consistent upward trend in topline growth, supported by rising customer activity and diversification of investment products.
- Revenue Growth: Significant increase across reporting periods, driven by higher transaction volumes and premium product adoption.
- FY24 Dip: A marginal decline in net profit was noted, primarily due to a one-time tax-related accounting adjustment. Importantly, the core business fundamentals remain robust.
- User Metrics: Groww boasts over 4 crore registered users, with millions of active investors using its app monthly — a testament to its brand trust and reach.
This performance cements Groww’s position as a category leader in India’s digital investing ecosystem.
Valuation & Expert Analysis
At the given price band, the Groww IPO appears fairly valued, especially considering the company’s rapid scalability, technology-driven model, and market share dominance.
While some analysts caution that valuations are on the higher side compared to traditional brokers, the growth potential in digital investing justifies the premium. With rising financial literacy and increasing retail participation in markets, platforms like Groww could continue to benefit from structural tailwinds.
Expert View:
For investors with a medium-to-long-term horizon, the Groww IPO presents a stable and promising investment opportunity. Short-term listing gains might depend on overall market sentiment and subscription demand, but long-term value creation seems intact.
Competitive Landscape: Where Groww Stands
Groww competes with other online investment platforms like Zerodha, Upstox, Angel One, and traditional brokers. However, its unique advantage lies in:
- Simple, intuitive interface appealing to new-age investors
- Strong brand recall among millennials and Gen Z
- Focus on investor education through Groww Academy and content outreach
Still, competition in this space remains fierce, making differentiation through research, technology, and support even more critical.
This is where Swastika Investmart holds an edge — with its SEBI registration, robust research tools, dedicated customer support, and a tech-enabled platform designed for both beginners and experienced traders.
Market Context: Why the Groww IPO Matters
The Groww IPO isn’t just another fintech listing — it’s symbolic of India’s digital finance revolution.
With over 11 crore demat accounts now open in India (as of FY25), the democratization of investing has reached unprecedented levels. Regulatory initiatives by SEBI and RBI continue to support transparency and investor protection — creating a healthy environment for platforms like Groww to thrive.
This IPO reflects confidence in India’s fintech story and retail participation boom — a structural shift that will likely continue through the decade.
Risks to Consider
While the growth story is impressive, investors should be mindful of certain risks:
- Regulatory dependencies: Any change in SEBI norms or compliance costs can impact operations.
- Competition: High customer acquisition costs in fintech could pressure margins.
- Market volatility: As an investment-driven business, Groww’s revenues may fluctuate with trading volumes.
Hence, investors should align expectations with their risk appetite and investment horizon.
FAQs
1. What are the Groww IPO dates?
The Groww IPO opens on November 4, 2025, and closes on November 7, 2025.
2. What is the Groww IPO price band?
The price band is ₹95 to ₹100 per share.
3. Is Groww profitable?
Yes, Groww has shown profitability in recent periods. The FY24 dip was due to a one-time tax-related adjustment, not operational weakness.
4. Should retail investors apply for the Groww IPO?
If you have a medium to long-term view, Groww’s IPO can be considered a stable investment backed by strong fundamentals and brand trust.
5. Where can I apply for the Groww IPO?
You can apply through your broker, bank ASBA, or trusted platforms like Swastika Investmart.
Final Verdict: Should You Apply?
In simple terms — Groww IPO looks promising for long-term investors who believe in India’s fintech growth story. The company’s strong market share, customer base, and tech-driven innovation make it a strong player in the evolving financial landscape.
However, as with any IPO, investors should review their risk tolerance and avoid expecting overnight returns.
If you’re looking to apply for the Groww IPO or explore other investment opportunities, consider opening your trading account with Swastika Investmart — your trusted SEBI-registered partner for research-driven, tech-enabled, and transparent investing.
How to Set Stop Loss and Target Levels in Intraday Trading: A Practical Guide for 2025
Key Takeaways
- A Stop Loss (SL) limits downside risk; a Target (TP) secures profit.
- Use a Risk–Reward Ratio (1:2 or 1:3) to balance trades.
- ATR, support/resistance, and VWAP help find logical SL/TP zones.
- Avoid emotional exits follow data and discipline.
- Swastika Investmart provides tools & research-backed alerts for smart intraday traders.
Introduction: Why Stop Loss and Target Levels Matter
In intraday trading, profitability isn’t about how many trades you win it’s about how much you lose when you’re wrong.
That’s why professional traders swear by two golden tools:
- Stop Loss (SL) the price level where you’ll exit if the trade goes against you.
- Target (TP) the price level where you’ll lock in profit when your analysis plays out.
Setting them wisely protects you from emotional trading and ensures consistent returns.
Let’s explore how to calculate and execute stop loss and target levels using both data and discipline.
1. What Is Stop Loss in Intraday Trading?
A Stop Loss is a pre-decided exit price that limits your potential loss.
It ensures that one bad trade doesn’t wipe out your capital.
Example:
You buy Infosys at ₹1,500 expecting a rise to ₹1,530.
If your Stop Loss is ₹1,490, your maximum loss = ₹10 per share.
Stop Loss is your safety shield, not a weakness.
Key Benefits:
✅ Protects capital in volatile markets.
✅ Removes emotional decision-making.
✅ Builds discipline and consistency.
2. What Is a Target Price (Take Profit)?
A Target Price (TP) is the level at which you plan to book profit.
It’s usually based on your risk–reward ratio or technical resistance levels.
Example:
If you risk ₹10 per share and aim for ₹20 gain, your target is ₹1,520 (2× your risk).
That’s a 1:2 risk–reward ratio the benchmark for sustainable trading.
3. The Risk–Reward Ratio: Your Secret Formula
The Risk–Reward Ratio (RRR) compares how much you could gain to how much you’re risking.
Risk–Reward Ratio = (Target – Entry) ÷ (Entry – Stop Loss)
Pro Tip:
Never take trades below 1:1.5 risk–reward. Professionals aim for 1:2 or higher, ensuring small losses, big wins.
4. How to Set Stop Loss: Proven Techniques
There’s no “one-size-fits-all” stop loss it depends on your strategy and volatility.
(a) Technical Stop Loss (Chart-Based)
Use support or resistance zones on charts:
- For long positions, place SL just below support.
- For short positions, place SL just above resistance.
(b) ATR-Based Stop Loss (Volatility Method)
Use Average True Range (ATR) to set SL dynamically.
Stop Loss = Entry – (1.5 × ATR) for buy trades.
Stop Loss = Entry + (1.5 × ATR) for sell trades.
ATR adapts your stop to market volatility tighter when calm, wider when volatile.
(c) Percentage-Based Stop Loss
Decide risk per trade as a % of your capital (e.g., 1%).
If your capital = ₹1,00,000, you can risk ₹1,000 per trade.
If stock = ₹500, lot size = 100 shares → ₹10 per share risk = ₹1,000 total.
5. How to Set Target Levels
Targets should always align with market structure not just your wish list.
(a) Fixed Risk–Reward Method
Use ratios like 1:2 or 1:3 (risk ₹10 → aim ₹20–₹30 profit).
(b) Swing High/Low Method
Identify the next resistance (for buy) or support (for sell) on charts as your target.
(c) VWAP or Pivot Levels
These dynamic indicators show where price may pause or reverse perfect for setting smart targets in intraday trades.
6. Stop Loss & Target Example
Let’s put it all together 👇
This approach lets you plan the trade before placing it, ensuring emotion-free decision-making.
7. Common Mistakes to Avoid
🚫 Moving Stop Loss after entry discipline first!
🚫Setting tight SL in volatile stocks allow breathing room.
🚫 No defined target leads to greed-based exits.
🚫 Ignoring trailing stop loss use it to lock in profits as price moves in your favor.
8. How SEBI and Brokers Help You Stay Disciplined
The Securities and Exchange Board of India (SEBI) mandates robust risk systems for intraday traders.
Modern brokers like Swastika Investmart enhance this with:
- AI-driven trade alerts for price breaches.
- Margin tracking dashboards for capital safety.
- Auto Stop Loss & Bracket Order (BO) features for risk control.
- Educational webinars to teach retail traders smart risk strategies.
Trading with a SEBI-regulated broker ensures your trades are secure, transparent, and compliant.
9. AI + Stop Loss: The Future of Risk Control
AI now plays a big role in intraday trading.
AI-powered systems track your trade history, volatility patterns, and win-loss ratios to suggest personalized stop loss and target levels.
Swastika Investmart’s next-gen platforms are integrating machine learning analytics that automatically recommend stop levels based on past volatility and trader behavior a big leap toward smarter, emotion-free trading.
FAQs
1. What is the ideal risk–reward ratio for intraday traders?
A minimum of 1:2 ensures your average profits outweigh occasional losses.
2. How to choose between fixed and dynamic stop loss?
Use fixed SL for stable stocks and ATR-based SL for volatile ones like Bank NIFTY or crude oil.
3. Should I always place a stop loss?
Yes skipping SL is the number one reason traders lose money. Always protect your downside.
4. What is a trailing stop loss?
A trailing SL moves up as the price moves in your favor locking profits without exiting too early.
5. How does Swastika Investmart help in stop loss management?
Swastika provides auto SL order types, AI alerts, and risk calculators, making trade management easy, even for beginners.
Conclusion
In intraday trading, success doesn’t come from predicting it comes from protecting.
Your stop loss defines how much you can lose; your target defines how much you can earn.
By applying a disciplined risk–reward strategy, aligning trades with support/resistance or ATR levels, and using AI-powered broker tools like those from Swastika Investmart, you can trade confidently and sustainably.
Because in the long run, traders who control risk control success.

SEBI Tightens Rules for Index Derivatives — Here’s What’s Changing
Key Takeaways
- SEBI introduces stricter eligibility and risk-control measures for index derivatives.
- New rules focus on liquidity, volatility control, and better risk management.
- Retail traders will see changes in contract design and margin norms.
- Broader aim: to curb speculation and protect investor interests.
- Swastika Investmart’s tools and research help investors adapt seamlessly to the new framework.
A Major Overhaul in India’s Derivatives Market
The Securities and Exchange Board of India (SEBI) has once again stepped up to tighten the regulatory framework around index derivatives — one of the most actively traded segments in India’s financial markets.
The move comes after SEBI observed rising speculative activity and excessive short-term volatility in index futures and options, especially in popular benchmarks like Nifty50 and Bank Nifty.
These changes are not meant to discourage trading but to ensure that derivatives serve their true purpose — risk management and hedging, not unchecked speculation.
What Exactly Has Changed?
Here’s a simple breakdown of what SEBI’s new rules bring to the table 👇
1. Stricter Eligibility Criteria for New Index Launches
Earlier, exchanges could easily introduce new sectoral or thematic indices for trading in futures and options.
Now, SEBI mandates that:
- The index must represent a broad-based market segment (not just a handful of stocks).
- Each constituent stock must have adequate liquidity.
- At least 80% of the index weight should come from stocks that are already part of existing derivatives.
Impact: This ensures that new indices are less prone to manipulation and have sufficient depth for fair price discovery.
2. Revised Contract Design and Lot Sizes
SEBI has asked exchanges to review lot sizes and contract values regularly.
- The minimum contract value must now align with current volatility and liquidity levels.
- Smaller lot sizes may be adjusted upwards to reduce over-leveraging by retail traders.
Example: If a Nifty derivative lot currently represents ₹10 lakh exposure, the revised rules may increase this threshold to ₹15–20 lakh depending on volatility.
Impact: Retail traders will need to manage position sizing and margin requirements more prudently.
3. Enhanced Risk Management Norms
To prevent extreme swings, SEBI has strengthened its risk and margin framework:
- Dynamic margin requirements will adjust in real time to volatility.
- Exposure limits will be more closely monitored, especially for high-frequency or intraday traders.
- Stress-testing mechanisms will ensure clearing corporations can handle worst-case market scenarios.
Outcome: A more stable and resilient derivatives ecosystem, especially during high-stress events like elections or global market shocks.
4. Tightened Rules for Weekly Expiries
In recent years, weekly options — especially Bank Nifty contracts — have become a trader favorite. But they’ve also increased short-term speculative volatility.
SEBI has asked exchanges to review and rationalize the number of weekly expiries available for trading.
Impact: This may reduce ultra-short-term speculation but improve long-term market health by focusing on monthly contracts.
5. Greater Transparency and Data Reporting
Exchanges must now publish more detailed data on open interest, position concentration, and volatility patterns.
This gives retail investors and analysts better visibility into market behavior.
Investor Benefit: Transparent data leads to more informed decision-making and helps prevent herd behavior.
Why SEBI Is Tightening the Rules Now
Over the past year, India’s derivatives volumes have exploded — daily F&O turnover crossed ₹400 trillion, far outpacing the cash market. While high participation signals growing market depth, it also raises concerns about:
- Speculative trading overshadowing investment activity.
- Retail traders taking excessive leveraged positions.
- Systemic risks during sharp market corrections.
By tightening the rules, SEBI aims to strike a balance between accessibility and accountability. The reforms align India’s markets with global best practices, similar to frameworks followed by the U.S. SEC and European ESMA.
Impact on Indian Markets
Short-Term:
- Lower intraday volatility in popular indices like Nifty and Bank Nifty.
- Possible dip in trading volumes as retail traders recalibrate strategies.
Long-Term:
- Improved market stability and reduced manipulation.
- Healthier participation from institutional investors.
- Enhanced trust and confidence in India’s derivatives ecosystem.
For Indian markets, this is a sign of maturing regulation — a necessary step to protect investors and ensure sustainable growth.
How Traders Can Adapt
- Revisit trading strategies: Focus on quality setups instead of high-frequency trades.
- Manage leverage smartly: Keep margins ready for higher exposure requirements.
- Use analytical tools: Platforms like Swastika Investmart offer market data, research reports, and derivatives screeners to track open interest and volatility trends.
- Stay updated: Regularly check SEBI circulars and exchange notifications.
How Swastika Investmart Helps You Navigate the Change
As a SEBI-registered brokerage and research house, Swastika Investmart combines robust research tools with investor education and real-time market analytics.
With features like:
- Smart derivatives tracking
- Advanced margin calculators
- Personalized support and research insights
Swastika helps both beginners and experienced traders adapt to regulatory changes smoothly — ensuring your trades remain informed, compliant, and efficient.
FAQs
1. Why did SEBI introduce new rules for index derivatives?
To reduce excessive speculation, enhance transparency, and strengthen risk management in India’s fast-growing F&O market.
2. Will these rules affect retail traders?
Yes, mainly through higher contract values and dynamic margining, encouraging disciplined and risk-aware trading.
3. Are weekly options being removed?
No, but SEBI has advised exchanges to rationalize weekly expiries to curb short-term volatility.
4. How do these changes benefit long-term investors?
Lower volatility and better liquidity create a more stable market, benefiting investors with long-term equity positions or index-based portfolios.
5. How can I prepare for these changes?
Stay informed, manage your positions conservatively, and use research-backed platforms like Swastika Investmart for guidance.
Conclusion
SEBI’s new rules for index derivatives mark a crucial step toward a healthier and more disciplined market structure. While traders may initially feel the pinch of tighter margins and contract adjustments, the long-term impact is overwhelmingly positive — improved transparency, reduced volatility, and stronger market integrity.
For investors and traders who want to stay ahead with expert insights, Swastika Investmart offers a trusted, SEBI-registered platform with advanced research tools and personalized assistance to help you make smarter, safer trading decisions.
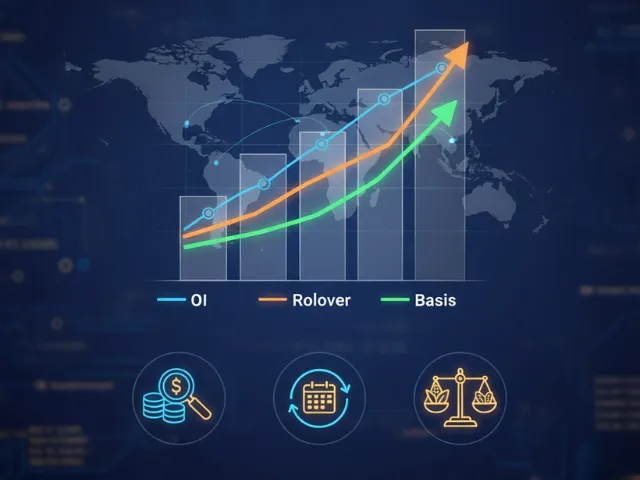
How to Read Commodity Futures Data: OI, Rollover & Basis Explained
Key Takeaways
- Open Interest (OI) shows trader participation and trend strength.
- Rollover reveals how many contracts are carried to next month’s expiry.
- Basis measures spot–futures price gap and sentiment.
- Together, they help traders spot long/short build-ups in commoditie
- Swastika Investmart provides SEBI-compliant analytics & expert insights for futures traders.
Introduction: Why Commodity Futures Data Matters
Commodity futures trading in India has evolved into a data-driven discipline. Successful traders today don’t just rely on price they decode Open Interest (OI), Rollover, and Basis to understand market positioning, strength, and sentiment.
Whether you trade on the Multi Commodity Exchange (MCX) or National Commodity & Derivatives Exchange (NCDEX), learning to interpret these metrics can transform the way you make decisions.
Let’s break them down in simple terms and see how brokers like Swastika Investmart help you read them efficiently.
1. What Is Open Interest (OI)?
Open Interest (OI) refers to the total number of outstanding contracts (buy or sell) that remain open in a commodity’s futures market.
- Rising OI means new positions are being built.
- Falling OI means traders are closing their positions.
In simple words: OI shows how many traders are active and how confident they are in the trend.
Example:
If Crude Oil futures prices rise from ₹6,800 to ₹7,000 and OI also rises, it means new long positions are being added bullish sentiment.
Swastika Investmart’s live OI trackers and heatmaps help traders identify these patterns in real time across commodities.
2. What Is Rollover in Commodity Futures?
Futures contracts have expiry dates monthly for most commodities. As expiry nears, traders either square off or roll over their positions to the next month’s series.
Rollover (%) = (Next Month OI / Current Month OI) × 100
A higher rollover percentage shows continuity of conviction traders are carrying their view forward.
Example:
If Gold futures rollover is 85%, it means most traders are confident about the trend continuing in the next month’s contract.
Swastika Investmart’s derivatives dashboard visually compares rollover ratios across series, helping you track where institutional money is flowing.
3. What Is Basis and Why Does It Matter?
Basis = Futures Price – Spot Price
It measures the difference between current futures and spot (cash) prices.
- Positive Basis (Futures > Spot): Bullish tone (cost of carry or storage).
Negative Basis (Futures < Spot): Bearish tone (weak demand or oversupply).
Example:
If Copper spot = ₹720 and Futures = ₹730, basis = +₹10 → bullish undertone.
If Futures = ₹710 → basis = –₹10 → bearish tone or oversupply.
4. Combining OI, Rollover, and Basis for Better Analysis
Smart traders don’t look at these metrics in isolation they combine all three to read the full market picture.
5. SEBI’s Role in Safeguarding Commodity Traders
SEBI (Securities and Exchange Board of India) ensures commodity futures trading remains transparent and regulated through:
- Margin requirements to control leverage risk.
- Daily mark-to-market (MTM) settlement.
- Position limits to avoid excessive speculation.
- Real-time data disclosure for OI, rollover, and basis via MCX/NCDEX.
Swastika Investmart’s trading systems follow all SEBI guidelines, ensuring traders have safe, compliant access to futures data.
6. AI & Analytics in Reading Commodity Data
The future of commodity analysis is AI-enhanced.
Modern platforms now use machine learning to analyze OI spikes, basis fluctuations, and rollover trends.
AI tools can even predict probable breakouts in commodities like Gold, Crude, or Copper by studying patterns across contracts.
FAQs
1. What does Open Interest indicate in commodity futures?
It shows total open contracts rising OI means new positions (bullish or bearish), falling OI means closure or unwinding.
2. How can rollover help traders?
Rollover reveals how many traders carry positions to the next month, reflecting conviction in the trend.
3. What does basis tell us?
Basis shows whether futures are trading at a premium or discount to spot indicating market sentiment.
4. How is SEBI involved in commodity futures?
SEBI regulates all trading activity, margins, and reporting standards to ensure transparency and investor protection.
5. How does Swastika Investmart help commodity traders?
Swastika offers real-time analytics, AI-integrated insights, and SEBI-compliant execution, helping traders decode OI, rollover, and basis effectively.
Conclusion
Reading commodity futures data is the art of understanding what the market is thinking not just what the price is doing.
By tracking Open Interest, Rollover, and Basis, you gain insights into trader psychology, institutional positioning, and upcoming trends.
And when you trade through Swastika Investmart, you combine that insight with research-backed data, advanced dashboards, and SEBI-regulated safety.
In the AI-driven era of 2025, data isn’t just information it’s your competitive advantage.
👉 Open your Demat & Trading Account with Swastika Investmart — trusted SEBI-registered broker with expert research, powerful tools, and dedicated customer support.
%20(9).webp)
Is Lenskart IPO Worth Your Money? Full Reality Check!
Key Takeaways
- IPO size: ₹7,278 crore (₹2,150 crore fresh issue + ₹5,128 crore OFS)
- Valuation: Extremely high – P/E above 200x, EV/Sales near 10x
- Profit quality: FY25 profit inflated by a one-time non-cash gain
- Strengths: Strong brand, omnichannel presence, investor confidence
- View: Solid business, but valuations look stretched → Neutral rating.
A Stylish IPO with a Price Tag to Match
Lenskart Solutions Ltd., founded in 2008, has transformed from an online eyewear seller into India’s largest tech-enabled eyewear retailer. With over 2,723 stores across India and overseas, the company manufactures, designs, and retails prescription glasses, sunglasses, and contact lenses through its own platform and app (over 100 million downloads).
After years of steady growth, Lenskart turned profitable in FY25 with a net profit of ₹297 crore and an EBITDA margin of 13.85%, up from 11.98% in FY24. The company’s revenue jumped 22.6% YoY to ₹6,652 crore, showing strong operating momentum.
But is that enough to justify its ₹70,000 crore market cap? Let’s break it down.
IPO Details at a Glance
Where the Money Will Go
The company plans to use the IPO proceeds for:
- Expanding company-owned stores (CoCo model) and meeting related lease costs.
- Investing in technology infrastructure, cloud systems, and marketing.
- Acquisitions and general corporate purposes.
Why Investors Are Interested
1. India’s Eyewear Market = Huge Opportunity
India’s eyewear industry is under-penetrated, with a large unorganized segment. Lenskart’s direct-to-consumer approach, backed by tech-driven supply chains and omnichannel reach, gives it a strong foothold in this expanding market.
2. Strong Brand Recall
With affordable yet trendy eyewear, Lenskart enjoys strong customer loyalty, particularly among millennials and Gen Z consumers.
3. Veteran Investor Backing
The entry of Radhakishan Damani, a respected market veteran, has boosted confidence among investors and analysts alike.
The Flip Side: Why You Should Be Cautious
1. Aggressive Valuation
Lenskart’s valuation metrics are sky-high.
- P/E: 200x+
- EV/Sales: ~10x
At these levels, the stock is priced for perfection, leaving minimal room for error if growth slows or margins shrink.
2. Profit Quality Concerns
FY25’s ₹297 crore profit primarily came from a one-time non-cash accounting gain, raising questions about the sustainability of earnings in future periods.
3. High Dependence on China
Over 40% of raw material and component sourcing is tied to Chinese suppliers via joint ventures, exposing the company to geopolitical risks and supply disruptions.
4. Competitive Pressure
Competition is rising from both online and offline eyewear players, including Titan’s Eye+ and new D2C startups. Maintaining growth while preserving margins could be challenging.
Market Context: Why It Matters
The Lenskart IPO arrives at a time when investor appetite for consumer tech companies is strong, but valuations are under scrutiny. With peers like Mamaearth and Boat facing post-listing volatility, investors are becoming cautious.
The company’s ₹7,278 crore issue, where 70% of funds (OFS) go to existing shareholders, signals that much of the offer is an exit opportunity for early investors rather than a pure growth capital raise.
Swastika Investmart’s View
Swastika Investmart has assigned a Neutral Rating to the Lenskart IPO.
The business fundamentals are solid — large customer base, strong brand, scalable tech model — but valuation comfort is missing.
For long-term investors, it may be worth watching post-listing performance before taking exposure.
FAQs
1. What is the Lenskart IPO price band?
The price band is set between ₹382 and ₹402 per share.
2. How much of the IPO is fresh issue?
₹2,150 crore is a fresh issue, while ₹5,128 crore is an offer for sale by existing shareholders.
3. Is Lenskart profitable?
Yes, the company turned profitable in FY25 with ₹297 crore net profit, though most of it came from a one-time accounting gain.
4. What is Swastika’s recommendation?
Swastika Investmart gives a Neutral rating — strong business, but valuations are on the higher side.
5. Should retail investors apply?
Apply only if you believe in long-term growth potential and can tolerate near-term valuation risk.
Conclusion
Lenskart’s IPO brings together a powerful mix of brand strength, tech-driven growth, and a booming consumer market. However, the steep valuation and profit quality concerns make it a case of “great company, expensive price.”
For investors looking for balanced, research-backed guidance and reliable support, Swastika Investmart offers SEBI-registered expertise, strong research tools, and tech-enabled investing platforms to help you make informed decisions.
👉 Open your Demat & Trading Account with Swastika Investmart — trusted SEBI-registered broker with expert research, powerful tools, and dedicated customer support.

Navigating the Private Equity Funding Process in an Investment Bank
For owners and promoters of successful, growing companies, seeking private capital often feels like a complicated and crucial process. You know your firm has tremendous potential, but turning that potential into a successful partnership with a Private Equity (PE) investor demands a clear strategy, not just strong performance.
This is the central promise of a specialized Boutique Investment Bank. It involves a step-by-step approach designed to boost your company's value, manage its presentation to the market, and guarantee long-term alignment with a new investor. Our Investment Banking experts explain this proven journey, from the initial planning stages to securing the necessary funds.
Phase I: Planning the Transaction and Defining Value
1. The Mandate
Every successful private equity deal starts by clearly defining a goal. The company, guided by an Investment Bank, must decide precisely what it wants to achieve: Is it raising capital for expansion, selling a portion of the company, or planning a full merger or sale?
This clear direction is formally captured in a mandate letter. This document ensures the promoter, management, and the investment bank are fully aligned on roles, timelines, and the ideal investor profile. This upfront agreement is vital, ensuring the process is focused on the company's long-term value creation, not just a quick cash injection.
2. Valuation and Structure
Determining your company's worth, or Valuation, is the foundation of any transaction. A skilled investment banker uses rigorous financial analysis combined with real-time market knowledge to arrive at a fair and defensible value range.
We determine the basis of valuation using several standard approaches, including:
- Discounted Cash Flow (DCF): Estimating value based on how much cash the company is expected to generate in the future.
- Comparable Company Analysis (CCA): Benchmarking against the values of similar public companies in the same industry.
- Precedent Transactions (PTA): Looking at the price paid for similar companies in recent mergers and acquisitions (M&A).
The final valuation figure is more than just a spreadsheet result; it is also influenced by industry outlook and how well the company aligns with major investor trends, such as deep-tech or sustainability. In fact, reports confirm that India has seen significant mid-market growth investments, proving that the opportunity for well-prepared companies is strong.
Once the valuation is clear, the focus shifts to Deal Structuring. This means deciding on the best type of capital to raise—such as common shares or preferred shares—to balance the new investor’s returns with the promoter’s continued control and operational freedom. A smart structure significantly impacts the partnership's success.
Phase II: Attracting Partners and Negotiating Terms
3. Investor Outreach
With the groundwork laid, the Investment Bank begins presenting the company's compelling story to the market. This phase goes beyond simple marketing; it is a focused campaign to find the perfect strategic partner.
The main document used, often called an Information Memorandum (IM), details the business model, financial results, management team quality, and the value creation plan. This step outlines how Investor Outreach is done by finding investors who are truly the right fit.
The Investment Bank identifies and contacts a select group of potential investors, including dedicated private equity funds and family offices, who have a track record of investing in companies of the client's size and sector. Effective outreach relies on:
- Targeted Search: Focusing on PE funds with available funds and proven sector experience.
- Clear Messaging: Ensuring the company’s story is transparent, consistent, and appealing across all presentations.
- Managing Due Diligence: Guiding the investor through the verification phase in an organized, timely manner to build trust. Analysing the company through and through, from their bookkeeping to client records to order books, to understand the company better and enhance investors’ sense of clarity.
4. Term Sheets and Negotiation
When a serious investor expresses interest, they issue a Term Sheet, and the process moves into the critical negotiation game in equity. While the purchase price attracts the most attention, the most defining aspects of the partnership are found in the detailed clauses covering governance and rights.
The Investment Bank acts as an essential transaction advisor here. They help the promoter navigate complex issues like board composition, special rights for the investor, how the founders are incentivized, and plans for the eventual exit. Key elements under negotiation include:
- Partnership Safeguards: Rights investors use to protect their capital and influence.
- Governance: Determining the new balance of power in future strategic decisions.
- Exit Strategy: Planning the pre-agreed methods for the investor to eventually sell their stake.
The banker’s main job is to broker a balanced agreement that protects the promoter’s long-term vision while meeting the institutional investor’s requirements for a strong return, leading to a successful, aligned partnership.
Phase III: Finalizing the Deal and Sustaining Growth
5. Closure and Compliance
The final phase involves legally documenting the deal, turning the agreed-upon Term Sheet into a legally binding contract. This execution stage demands extreme focus on detailed paperwork and regulatory adherence.
The importance of Compliance in Equity is paramount, especially in a regulated market. Legal teams draw up final agreements, the investor completes their final due diligence and finalises the Shareholder’s Agreement (SHA)& Shareholders Share Subscription Agreement (SSA), and all required documents are filed with government & regulatory authorities and signed by involved parties to finalise and seal the deal. Accuracy is key, as small compliance errors can significantly delay the final closure.
6. Beyond the Deal: Strategic Partnership
Closing the transaction is a milestone, not an end. A good Boutique Investment Bank continues to provide advice after the deal is done, offering crucial support in areas like new board governance, investor communication, and long-term strategic planning.
Maintaining a relationship with a trusted Investment Bank ensures a company is positioned for ongoing success. It facilitates future funding rounds, supports strategic acquisitions (bolt-ons), and prepares the company for a maximum-value exit later on—a true demonstration of partnership and sustained value creation..
👉 To Connect with us today, please click here.

.webp)
.webp)

.webp)


START YOUR INVESTMENT JOURNEY
Get personalized advice from our experts
- Dedicated RM Support
- Smooth and Fast Trading App
