NHPC’s ₹26,070 Crore Hydroelectric Project: A Game-Changer for Growth?


Key Takeaways
- NHPC Ltd receives approval for a ₹26,070 crore hydroelectric project
- Project to be developed in partnership with the Arunachal Pradesh government
- Strengthens India’s renewable energy push and hydro capacity
- Long gestation period but strong long-term visibility
- Execution, funding, and timelines remain key factors
Introduction
India’s renewable energy ambitions are gaining momentum, and hydropower is once again coming into focus. In a significant move, NHPC Ltd has received approval for a ₹26,070 crore investment in the Kamala Hydroelectric Project.
This development not only strengthens NHPC’s project pipeline but also signals a broader policy push toward clean and sustainable energy. For investors, the key question is whether this project can truly act as a growth catalyst or if challenges around execution and timelines may limit its near-term impact.
Project Overview
The Kamala Hydroelectric Project will be implemented through a joint venture between NHPC and the Government of Arunachal Pradesh.
Key highlights
- Total investment: ₹26,070 crore
- Location: Arunachal Pradesh
- Structure: Joint venture model
- Objective: Expand hydroelectric capacity
Hydropower projects are capital-intensive and long-term in nature, often taking several years to become operational.
Strategic Importance of the Project
Strengthening Renewable Energy Portfolio
Hydropower plays a crucial role in balancing renewable energy sources like solar and wind. Unlike intermittent sources, hydro provides stable and flexible power.
For NHPC, this project enhances its position as a leading player in India’s renewable energy ecosystem.
Government Policy Support
India has been actively promoting renewable energy through policy initiatives and incentives. Large-scale hydro projects are now being recognized as an essential part of this transition.
Approvals from bodies like the Cabinet Committee on Economic Affairs reflect strong government backing for such investments.
Regional Development
Projects in the Northeast region contribute to:
- Infrastructure development
- Employment generation
- Improved connectivity
This aligns with the government’s broader focus on regional growth.
Impact on Indian Stock Market
Positive Signals for Investors
The project sends a strong message about NHPC’s growth ambitions.
- Expands long-term revenue visibility
- Reinforces leadership in hydro power
- Aligns with India’s clean energy goals
Such developments often improve investor sentiment, especially in PSU and energy stocks.
Sectoral Impact
The announcement may have a broader impact on:
- Renewable energy companies
- Power equipment manufacturers
- Infrastructure and EPC players
As hydro projects scale up, ancillary industries also benefit.
Financial Implications
High Capital Investment
A project of this scale requires significant funding.
- Potential increase in debt levels
- Long payback period
- Gradual revenue realization
Investors should be mindful that returns from such projects are not immediate.
Revenue Visibility
Once operational, hydro projects generate stable and predictable cash flows. This makes them attractive from a long-term perspective.
Risks to Consider
Execution Risk
Large infrastructure projects often face delays due to:
- Land acquisition challenges
- Environmental clearances
- Logistical constraints
Cost Overruns
Inflation in raw materials and delays can increase project costs, impacting profitability.
Regulatory and Environmental Factors
Hydropower projects require multiple approvals and are subject to environmental scrutiny, which can affect timelines.
Real-World Context
Globally, countries are increasingly investing in hydroelectric power as part of their renewable energy mix. In India, companies like NHPC are at the forefront of this transition.
With rising electricity demand and a push for clean energy, hydro projects are expected to play a key role in ensuring grid stability.
Investor Perspective
Short-Term View
- Limited immediate earnings impact
- Possible neutral to mild positive market reaction
Long-Term View
- Strong revenue visibility once operational
- Strategic alignment with energy transition
- Potential for steady cash flows
Investors with a long-term horizon may find such projects attractive.
Regulatory Framework
Projects of this scale operate under strict regulatory oversight. Institutions like the Securities and Exchange Board of India ensure transparency for listed companies, while government approvals add credibility to large investments.
What Should Investors Do?
Investors should take a balanced approach.
- Evaluate NHPC’s overall project pipeline
- Monitor funding strategy and execution progress
- Consider long-term potential rather than short-term gains
Hydropower investments are typically suited for patient investors.
FAQs
What is the size of NHPC’s new project?
The project involves an investment of ₹26,070 crore.
Where will the project be developed?
It will be developed in Arunachal Pradesh through a joint venture.
Is this project positive for NHPC stock?
It is positive from a long-term perspective but may not have an immediate impact on earnings.
What are the key risks?
Execution delays, cost overruns, and regulatory challenges are the main risks.
Should investors invest in NHPC now?
Investors should consider their risk appetite and investment horizon before making a decision.
Conclusion
NHPC’s ₹26,070 crore hydroelectric project reflects a strong commitment to India’s renewable energy future. While the scale of the investment is impressive, the benefits will unfold gradually over time.
For investors, this is not a short-term trigger but a long-term structural story. Tracking execution, funding, and policy developments will be key to understanding the real impact.
Navigating such opportunities requires the right guidance and tools. With SEBI registration, robust research capabilities, advanced technology, and a strong focus on investor education, Swastika Investmart empowers you to make informed investment decisions.
Big Budget


.webp)
.webp)
.webp)
.webp)
.webp)


.webp)
.webp)
.webp)
.webp)
Latest Articles

What is Short Covering? Meaning & Examples in the Indian Stock Market


Short covering is a crucial concept in the world of trading and investing, especially in the stock market. Whether you are a beginner or an experienced trader, understanding short covering can help you make more smart decisions. In this blog, we'll delve into the meaning of short covering, why traders engage in it, its effects on the market, and provide some clear examples to illustrate the concept. Let’s break it down into simple language and cover it comprehensively.
Understanding Short Selling
Before diving into short covering, it’s essential to understand short selling:
Short Selling: This is a strategy where a trader borrows shares of a stock and sells them on the market, with the intention of buying them back later at a lower price. The aim is to profit from a decline in the stock’s price.
Example: Suppose a trader believes that the stock of Reliance Industries, currently priced at ₹2,000, will drop to ₹1,800. The trader borrows 100 shares and sells them at ₹2,000 each, making ₹2,00,000. If the stock price falls to ₹1,800, the trader buys back the 100 shares for ₹1,80,000, returns the borrowed shares, and pockets the ₹20,000 difference.
What is Short Covering?
Short Covering: This occurs when traders who have sold stocks short decide to buy them back. This buying back is done to close their short positions. Essentially, it’s the act of purchasing shares to return the borrowed ones, thus closing the short trade.
Why Do Traders Cover Their Shorts?
There are several reasons why traders might decide to cover their shorts:
- To Lock in Profits: If the stock price has fallen as expected, traders will cover their shorts to realize their gains. This means they are buying back the shares at a lower price than they sold them for.
- To Cut Losses: If the stock price starts to rise instead of fall, traders may cover their shorts to prevent further losses. Unlike a standard stock purchase where the loss is limited to the amount invested, the potential loss in short selling is theoretically unlimited because there is no cap on how high the stock price can go.
- Changing Market Conditions: New information or changes in market sentiment can lead to short covering. For example, if a company reports unexpectedly strong earnings, the stock price may rise, prompting short sellers to cover their positions to avoid larger losses.
- Short Squeeze: Sometimes, a large number of short sellers may all try to cover their positions simultaneously, causing the stock price to spike even higher. This scenario is known as a short squeeze, and it can create a feedback loop where rising prices force more short sellers to cover, further driving up the price.
How Does Short Covering Affect the Market?
Short covering can have a significant impact on the market, particularly in stocks that are heavily shorted. Here’s how it works:
- Price Increase: When short sellers buy back shares to cover their positions, it increases demand for the stock, which can drive the price higher.
- Volatility: Short covering can add to market volatility, especially during a short squeeze. Rapid price increases can create panic buying among other traders, further escalating the stock price.
- Market Sentiment: The need for short covering can sometimes signal a shift in market sentiment. For example, if many traders are covering shorts because a stock is no longer expected to fall, it might indicate a more bullish outlook for that stock.
Examples of Short Covering in the Indian Stock Market
Example 1: Profitable Short Covering
A trader shorts 100 shares of Tata Motors at ₹500 per share, expecting the price to fall.
The stock price drops to ₹400 per share.
The trader decides to cover their short position by buying back the 100 shares at ₹400 each.
The trader sells at ₹500 and buys back at ₹400, making a profit of ₹100 per share, or ₹10,000 total.
Example 2: Short Covering to Cut Losses
A trader shorts 100 shares of Infosys at ₹1,000 per share, expecting the price to fall.
Contrary to expectations, the stock price rises to ₹1,200 per share.
To prevent further losses, the trader decides to cover their short position by buying back the 100 shares at ₹1,200 each.
The trader sells at ₹1,000 and buys back at ₹1,200, resulting in a loss of ₹200 per share, or ₹20,000 total.
Example 3: Short Squeeze Scenario
Positive news about the company, such as a major investment, causes the stock price to rise rapidly.
Short sellers scramble to cover their positions to avoid larger losses, creating a surge in buying activity.
This buying pressure pushes the stock price even higher, exacerbating the situation for other short sellers and creating a feedback loop.
Conclusion
Short covering is an essential concept in trading that can significantly impact stock prices and market dynamics. It involves buying back previously shorted shares to close a short position, either to lock in profits or to cut losses. Understanding short covering and its implications can help traders make decisions and better navigate the complexities of the stock market. In the Indian stock market, where volatility can be high, being aware of strategies like short selling and short covering is crucial for successful trading.
Whether you're a beginner or an experienced trader, understanding short covering can empower you to respond effectively to market movements and protect your investments. As always, staying informed and applying disciplined trading principles are key to navigating the dynamic world of stock trading.

Top 12 Books on Investment, Trading, and the Stock Market
Investing and trading in the stock market can be daunting, especially for beginners. Fortunately, numerous books written by experts offer valuable insights and guidance. Here, we present the top 12 books on investment, trading, and the stock market that cater to both novice and experienced investors. These books cover various strategies, principles, and real-life experiences that can help you make educated decisions and build wealth.
1. "The Intelligent Investor" by Benjamin Graham
Often recognized as the bible of investing, this classic book emphasizes the importance of value investing and the concept of "margin of safety." Benjamin Graham's timeless principles are essential for anyone looking to build a solid foundation in investing.
Key Takeaways:
Focus on long-term value rather than short-term gains.
Protect yourself from significant losses by investing with a margin of safety.
2. "A Random Walk Down Wall Street" by Burton G. Malkiel
Burton Malkiel argues that stock prices are unpredictable and that trying to time the market is useless. He advocates for a diversified portfolio and explains various investment strategies.
Key Takeaways:
Embrace the unpredictability of the market.
Diversify your investments to minimize risk.
3. "One Up On Wall Street" by Peter Lynch
Peter Lynch shares his investment philosophy of finding undervalued companies with growth potential. He emphasizes the importance of doing thorough research and understanding the companies you invest in.
Key Takeaways:
Invest in what you know and understand.
Look for companies with growth potential that the market has overlooked.
4. "The Little Book of Common Sense Investing" by John C. Bogle
John Bogle, the founder of Vanguard Group, advocates for low-cost index fund investing. This book is perfect for beginners looking to understand the benefits of passive investing.
Key Takeaways:
Index funds offer a low-cost way to achieve market returns.
Keep investment costs low to maximize your returns.
5. "Market Wizards" by Jack D. Schwager
Jack Schwager interviews some of the most successful traders and investors, uncovering their strategies, mindsets, and experiences. This book offers valuable insights into the world of professional trading.
Key Takeaways:
There are many ways to succeed in trading.
Discipline and risk management are crucial for success.
6. "The Essays of Warren Buffett" by Warren Buffett and Lawrence A. Cunningham
This compilation of Warren Buffett's letters to shareholders offers a deep dive into his investment philosophy and principles. It's a must-read for anyone interested in understanding the mindset of one of the greatest investors of all time.
Key Takeaways:
Focus on long-term value and quality companies.
Maintain a disciplined and patient approach to investing.
7. "Reminiscences of a Stock Operator" by Edwin Lefèvre
A fictionalized account of the life of Jesse Livermore, a famous stock trader, this book provides timeless lessons on trading psychology, market speculation, and risk management.
Key Takeaways:
Learn from both successes and failures.
Understand the psychological aspects of trading.
8. "Common Stocks and Uncommon Profits" by Philip Fisher
Philip Fisher introduces the concept of growth investing and explains how to identify companies with long-term growth potential. His insights are valuable for those looking to invest in innovative and forward-thinking companies.
Key Takeaways:
Focus on companies with strong growth prospects.
Conduct thorough research to understand a company's potential.
9. "The Psychology of Investing" by John R. Nofsinger
This book delves into the psychological factors that influence investment decisions. Understanding these factors can help investors avoid common pitfalls and make more rational choices.
Key Takeaways:
Be aware of emotional biases that can affect your decisions.
Develop a disciplined approach to investing.
10. "Flash Boys" by Michael Lewis
Michael Lewis explores the rise of high-frequency trading and its impact on the stock market. This book offers a fascinating look into the complexities and ethical issues surrounding modern trading practices.
Key Takeaways:
Understand the impact of technology on trading.
Be aware of the ethical considerations in the financial markets.
11. "The Big Short" by Michael Lewis
Another masterpiece by Michael Lewis, "The Big Short" tells the story of the 2008 financial crisis through the eyes of traders who saw it coming. This book provides valuable insights into market dynamics and the importance of skepticism and due diligence.
Key Takeaways:
Question conventional wisdom and do your research.
Be prepared to act on your convictions, even if they go against the mainstream.
12. "Rich Dad Poor Dad" by Robert T. Kiyosaki
While not exclusively about stock market investing, this book provides essential lessons on financial literacy, asset management, and building wealth. It's an excellent starting point for anyone looking to improve their financial knowledge.
Key Takeaways:
Invest in assets that generate income.
Focus on building long-term wealth through smart financial decisions.
Conclusion
These top 12 books offer a wealth of knowledge on investment, trading, and the stock market. Whether you're a beginner looking to get started or an experienced investor seeking to refine your strategies, these books provide valuable insights and practical advice. By learning from the experiences and philosophies of successful investors and traders, you can enhance your understanding of the markets and make smarter choices on your journey to financial success. Happy reading!

Swing Trading- Meaning, Objective & How Does It Work
In the world of investing, swing trading stands out as a strategy that blends the excitement of short-term trading with the potential for significant gains. Unlike day trading, which involves buying and selling stocks within the same trading day, swing trading allows investors to hold onto stocks for several days or even weeks. This approach aims to capitalize on "swings" or price movements within a trend, whether upward or downward.
Understanding Swing Trading
What is Swing Trading?
Swing trading involves taking advantage of price swings or fluctuations in the market over a period of days to weeks. Unlike day traders who aim to capitalize on intraday price movements, swing traders hold positions for a longer duration to capture potential gains arising from trends in the market.
Objectives of Swing Trading
- Capturing Price Swings: The primary objective of swing trading is to identify and capitalize on short-term price movements within an established trend. Swing traders aim to enter positions at strategic points where they anticipate the price will reverse or continue its trend.
- Maximizing Profits: By holding positions for several days to weeks, swing traders seek to maximize their profit potential compared to day traders who typically exit positions within the same trading day.
- Managing Risk: Risk management is crucial in swing trading. Traders set stop-loss orders to limit potential losses and establish clear exit points to lock in profits or cut losses if the trade moves against them.
- Adapting to Market Conditions: Swing traders are adaptable and can profit in both uptrending and downtrending markets. They can take long positions (buy) when anticipating upward movement or short positions (sell) in anticipation of downward movement.
How Does Swing Trading Work?
Swing trading relies heavily on technical analysis to identify potential entry and exit points. Here’s how it typically operates:
- Identifying Trends: Swing traders analyze price charts to identify trends, using indicators such as moving averages, trendlines, and chart patterns to confirm the direction of the market.
- Entry Points: Traders look for appropriate moments to enter a trade based on technical signals, such as a breakout above resistance or a bounce off support levels.
- Exit Points: Setting clear exit points is crucial. Traders often use trailing stop-loss orders or predefined profit targets to manage their trades effectively.
- Monitoring and Adjusting: Once a trade is executed, swing traders monitor their positions regularly, adjusting their strategy if market conditions change or new information arises.
Advantages of Swing Trading
- Flexibility: Swing trading offers flexibility by accommodating traders' schedules and allowing them to hold positions longer than day traders.
- Potential for Higher Returns: By capturing larger price moves compared to day trading, swing traders have the potential to achieve higher returns over time.
- Less Stressful: Swing trading can be less stressful than day trading since it involves fewer trades and less monitoring throughout the trading day.
- Suitable for Part-Time Traders: It is suitable for traders with other commitments who cannot dedicate full-time hours to monitoring the markets.
Risks to Consider
- Market Volatility: Swing trading exposes investors to market fluctuations, which can lead to rapid changes in stock prices and unexpected losses.
- Timing Risks: Poor timing in entry or exit points can result in missed opportunities or losses, highlighting the importance of accurate technical analysis.
- Psychological Pressures: The emotional toll of swing trading, including fear of missing out (FOMO) or panic selling during downturns, can impact decision-making and overall profitability.
Is Swing Trading Right for You?
While swing trading offers the potential for significant profits, it requires a solid understanding of technical analysis, risk management, and a disciplined approach. It may suit individuals who are comfortable with short-term market fluctuations and have the time to monitor their positions regularly.
Conclusion
Whether you're a seasoned investor or new to the world of trading, swing trading can be a powerful strategy to explore. By mastering the art of identifying trends, managing risks, and staying disciplined, you can harness the momentum of the market to achieve your financial goals. Remember, like any trading strategy, success in swing trading requires continuous learning, adaptability, and a keen eye for market opportunities.
Swing trading offers traders a versatile strategy to profit from short- to medium-term market fluctuations. By leveraging technical analysis, managing risk effectively, and adhering to disciplined trading principles, swing traders can enhance their chances of success in the dynamic world of financial markets. Whether you're new to trading or looking to diversify your investment approach, understanding swing trading can empower you to make smart decisions and navigate market volatility with confidence.
Learn how to profit from short-term market fluctuations. Start Trading Now!

Intraday Trading Time Analysis
Intraday trading, often referred to as day trading, involves buying and selling financial instruments within the same trading day. In India, this practice has gained immense popularity due to the potential for quick profits. Understanding the best times to trade can significantly enhance your trading success. This guide will break down intraday trading time analysis in India.
1. Understanding the Trading Hours
The Indian stock market operates on specific hours:
Pre-market session: 9:00 AM to 9:15 AM
Regular trading session: 9:15 AM to 3:30 PM
Post-market session: 3:40 PM to 4:00 PM
For intraday traders, the regular trading session is where the action happens.
2. Key Time Segments in Intraday Trading
a. Market Opening (9:15 AM to 10:30 AM)
- Volatility: The first hour after the market opens is usually the most volatile. This period is characterized by high trading volumes as traders react to overnight news and market events.
- Opportunities: High volatility can mean greater opportunities for profit, but it also carries higher risk. It’s crucial to be cautious and have a clear strategy.
b. Mid-morning Session (10:30 AM to 12:00 PM)
- Stability: After the initial rush, the market tends to stabilize. Price movements become more predictable, and trends start to form.
- Trend Analysis: This is a good time to identify and follow trends. Many traders find this period less risky compared to the opening session.
c. Midday Lull (12:00 PM to 1:30 PM)
- Low Activity: Trading volumes typically decrease during lunchtime. The market may move sideways with limited price fluctuations.
- Patience: This is a time for patience. Avoid making hasty decisions. Use this period to reassess your positions and plan your next moves.
d. Afternoon Session (1:30 PM to 3:00 PM)
- Pick-up in Activity: Trading activity picks up again as traders return from lunch. The market starts to show more movement.
- Trend Reversals: Be cautious of potential trend reversals. It’s a good time to lock in profits or set up new positions based on the emerging trends.
e. Closing Hour (3:00 PM to 3:30 PM)
- Increased Volatility: The last half-hour can be volatile as traders finalize their positions before the market closes.
- Strategic Exits: It’s important to manage your exits strategically. Avoid holding positions into the closing minutes to prevent unexpected losses.
3. Tips for Effective Intraday Trading
a. Use Technical Analysis
- Charts and Indicators: Utilize charts and technical indicators like Moving Averages, Bollinger Bands, and RSI (Relative Strength Index) to make smart decisions.
- Support and Resistance Levels: Identify key support and resistance levels to anticipate price movements.
b. Stay Updated with News
- Market News: Keep an eye on financial news and market updates. Economic reports, corporate earnings, and geopolitical events can impact market movements.
- Stock-specific News: Follow news related to specific stocks you’re trading. Positive or negative news can trigger significant price changes.
c. Risk Management
- Stop-loss Orders: Always use stop-loss orders to minimize potential losses. Decide in advance how much you’re willing to lose on a trade.
- Position Sizing: Don’t put all your capital into a single trade. Diversify your positions to spread risk.
d. Develop a Trading Plan
- Set Goals: Have clear goals for each trading day. Know your entry and exit points.
- Discipline: Stick to your trading plan. Avoid impulsive decisions driven by emotions.
4. Tools and Platforms for Intraday Trading
a. Trading Platforms
- Brokerage Accounts: Open a trading account with a reputable broker like Swastika that offers robust trading platforms and tools.
- Demo Accounts: Practice with a demo account before trading with real money to improve your skills.
b. Trading Tools
- Charting Software: Use advanced charting software to analyze market trends and patterns.
- Scanners: Stock scanners can help identify potential trading opportunities based on your criteria.
5. Conclusion
Intraday trading in India can be highly rewarding if approached with the right knowledge and strategy. Understanding the different time segments within the trading day, utilizing technical analysis, staying updated with news, and practicing risk management are key components of successful intraday trading. Always remember to trade with a plan and stay disciplined to navigate the dynamic world of intraday trading effectively.

Types of Orders
What Is an Order?
An order is an instruction given to a broker or brokerage firm to buy or sell a security for an investor. It's the basic way to trade in the stock market. Orders can be placed by phone, online, or through automated systems and algorithms. Once an order is placed, it goes through a process to be completed.
There are different types of orders, allowing investors to set conditions like the price at which they want the trade to happen or how long the order should stay active. These conditions can also determine whether an order is triggered or cancelled based on another order.
Types of Orders
Market Order
A market order is an instruction to buy or sell a stock at the current price available in the market. With a market order, the investor doesn't control the exact price they pay or receive—the market decides the price. In a fast-moving market, the price can change quickly, so you might end up paying more or receiving less than expected.
For example, if an investor wants to buy 100 shares of a stock, they will get those 100 shares at whatever the current asking price is at that moment. If the price is ₹500 per share, they’ll buy 100 shares for ₹500 each. However, if the price changes before the order is executed, they might pay a different amount.
Limit Order
A limit order is an instruction to buy or sell a stock at a specific price or better. This allows investors to avoid buying or selling at a price they don't want. If the market price doesn't match the price set in the limit order, the trade won't happen. There are two types of limit orders: a buy limit order and a sell limit order.
Buy Limit Order:
A buy limit order is placed by a buyer, specifying the maximum price they are willing to pay. For example, if a stock is currently priced at ₹900, and an investor sets a buy limit order for ₹850, the order will only go through if the stock price drops to ₹850 or lower.
Sell Limit Order:
A sell limit order is placed by a seller, specifying the minimum price they are willing to accept. For example, if a stock is currently priced at ₹900, and an investor sets a sell limit order for ₹950, the order will only go through if the stock price rises to ₹950 or higher.
Stop Order
A stop order, also known as a stop-loss order, is a trade order that helps protect an investor from losing too much money on a stock. It automatically sells the stock when its price drops to a certain level. While stop orders are commonly used to protect a long position (where the investor owns the stock), they can also be used with a short position (where the investor has sold a stock they don't own yet). In that case, the stock would be bought if its price rises above a certain level.
Example for a Long Position:
Imagine an investor owns a stock currently priced at ₹1,000. They're worried the price might drop, so they place a stop order at ₹800. If the stock price falls to ₹800, the stop order will trigger, and the stock will be sold. However, the stock might not sell exactly at ₹800—it could be sold for less if the price is dropping quickly.
Example for a Short Position:
If an investor has shorted a stock at ₹1,000 and doesn't want to lose too much if the price rises, they might set a stop order at ₹1,200. If the price goes up to ₹1,200, the stop order will trigger, and the investor will buy the stock at that price (or higher if the price is rising quickly) to cover their short position.
To avoid selling at a much lower price than expected, investors can use a stop-limit order, which sets both a stop price and a minimum price at which the order can be executed.
Stop-limit order
A stop-limit order is a trade order that combines features of both a stop order and a limit order. It involves setting two prices: the stop price and the limit price. When the stock reaches the stop price, the order becomes a limit order. This means the stock will only be sold if it can meet or exceed the limit price, giving the investor more control over the selling price.
Let's say an investor owns a stock currently priced at ₹2,500. They want to sell the stock if the price drops below ₹2,000, but they don't want to sell it for less than ₹1,900. To do this, the investor sets a stop-limit order with a stop price of ₹2,000 and a limit price of ₹1,900.
If the stock price falls to ₹2,000, the stop order triggers, but the stock will only be sold if it can get at least ₹1,900 per share. If the price drops too quickly and falls below ₹1,900 before the order can be executed, the stock won’t be sold until it reaches ₹1,900 or higher.
In contrast, a regular stop order would sell the stock as soon as it hits ₹2,000, even if the price continues to fall rapidly and ends up selling for less. The stop-limit order gives the investor more control over the price, but there’s a chance the stock won’t sell if the limit price isn’t met.
Trailing stop order
A trailing stop order is a type of stop order that adjusts automatically based on the stock's price movement. Instead of setting a specific price, the trailing stop is based on a percentage change from the stock's highest price. This helps protect profits while allowing the stock to rise in value. If the stock's price falls by the set percentage, the order is triggered and the stock is sold.
Example for a Long Position:
Imagine an investor buys a stock at ₹1,000 and sets a trailing stop order with a 20% trail. If the stock price goes up to ₹1,200, the trailing stop will automatically move up to ₹960 (20% below ₹1,200). If the stock price then drops to ₹960 or lower, the trailing stop order will trigger, and the stock will be sold.
Example for a Short Position:
If an investor has shorted a stock at ₹1,000 and sets a trailing stop of 10%, the stop price would move down as the stock price falls. If the stock price rises by 10% from its lowest point, the trailing stop order will trigger, and the stock will be bought to cover the short position.
The trailing stop order allows the investor to lock in gains as the stock price moves favorably, while still providing protection if the market turns.
Immediate or Cancel (IOC) order
An Immediate or Cancel (IOC) order is a type of stock order that must be executed immediately. If the full order cannot be filled right away, whatever portion can be filled will be completed, and the rest will be canceled. If no part of the order can be executed immediately, the entire order is canceled.
Suppose an investor places an IOC order to buy 500 shares of a stock at ₹1,000 per share. If only 300 shares are available at ₹1,000 right away, the IOC order will purchase those 300 shares, and the remaining 200 shares will be canceled. If no shares are available at ₹1,000 immediately, the entire order will be canceled.
Good Till Cancelled (GTC) order
A Good Till Cancelled (GTC) order is a type of stock order that stays active until you choose to cancel it. Unlike other orders that expire at the end of the trading day, a GTC order remains open until you either cancel it or it gets executed. However, most brokerages set a limit on how long you can keep a GTC order open, usually up to 90 days.
Let's say an investor wants to buy a stock at ₹500, but the current price is ₹600. They place a GTC order to buy 100 shares at ₹500. This order will stay active until the stock price drops to ₹500 and the order is filled, or until the investor cancels the order. If the price never drops to ₹500 and the investor doesn't cancel the order, it will automatically expire after 90 days (or whatever time limit the brokerage sets).
Good 'Till Triggered (GTT) order
A Good 'Till Triggered (GTT) order is similar to a Good 'Til Canceled (GTC) order but with a key difference: a GTT order only becomes active when a specified trigger condition is met. Once the trigger price is reached, the order is placed in the market. If the trigger price is not reached, the order stays inactive.
Imagine an investor wants to buy a stock currently priced at ₹600, but only if it drops to ₹550. They set a GTT order with a trigger price of ₹550. If the stock price falls to ₹550, the order is activated and placed in the market. If the price never drops to ₹550, the order remains inactive until it reaches the trigger price or the investor cancels it.
GTT orders can also have a time limit, so if the trigger price isn’t reached within a certain period, the order will expire.
Conclusion
In the stock market, an order is a fundamental instruction to buy or sell a security, tailored to an investor's strategy and market conditions. The various types of orders—such as market, limit, stop, stop-limit, trailing stop, IOC, GTC, and GTT—offer flexibility to manage price, timing, and risk. Understanding these order types empowers investors to execute trades more effectively, ensuring alignment with their financial goals and risk tolerance.
Learn how to optimize your trades and manage risk with Swastika!

What is a Volatility Index?
A Volatility Index measures how much the market expects prices to fluctuate in the near future. Think of it as a risk indicator. In finance, this change in prices is often called as volatility. The Volatility Index tells us the expected level of volatility, expressed as a percentage (e.g., 20%).
What is India VIX?
The term "Volatility Index India," also referred to as "India VIX," describes a measure of the expected volatility of Nifty 50 Index options over the next thirty days. It may reflect what the market believes will happen to the Nifty 50 in the near future and can be calculated using the Black-Scholes model.
Imagine the stock market as a rollercoaster. Sometimes it's smooth sailing, and other times it's a wild ride. The India VIX (Volatility Index) is like a measure that tells you how bumpy that ride might be in the near future. It reflects how much investors expect the market to swing up and down over the next 30 days, using a percentage.
Example
Here's the breakdown:
- Low VIX (e.g., below 15%) suggests a calmer market with smaller price changes.
- High VIX (e.g., above 25%) indicates a more volatile market with bigger price changes.
India VIX shows an inverse relationship with the NIFTY index. When India VIX goes down, NIFTY usually goes up, and when VIX goes up, NIFTY tends to go down. Though it is relatively new, it has become a valuable tool for understanding market risk and volatility. Both experienced and new traders use it to navigate the stock market more effectively. By understanding this, you can reduce the fear of market volatility and make better trading decisions.
How is the India VIX calculated?
This index is computed using the Nifty 50 Index options order book as the foundation. The prices of Nifty options for the upcoming and nearing month are used to calculate volatility.
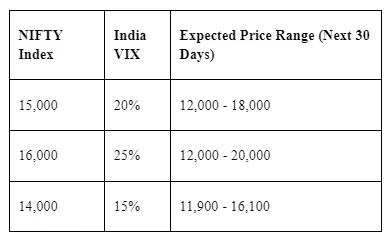
Example
Suppose the NIFTY 50 Index closed at 15,000 yesterday. If India VIX is 20%, it means the market expects the NIFTY 50 to fluctuate by 20% over the next year. So, the expected price range would be between 12,000 (20% below 15,000) and 18,000 (20% above 15,000).
How to Use India VIX for Trading
This is helpful for different types of traders and investors:
- Equity Traders: Use India VIX to understand market risk. If VIX is rising, prepare for more volatility.
- Long-term Investors: Use VIX to manage risk, even if short-term volatility is not a major concern.
- Options Traders: High VIX means higher option prices, good for option buyers. Low VIX is good for option sellers.
- Portfolio Managers: Adjust stock holdings based on VIX levels, holding more volatile stocks when VIX is low and safer stocks when it is high.
Benefits of using the India VIX:
- Risk Management: It helps you measure potential market risks, allowing you to adjust your trading strategies accordingly.
- Market Sentiment: A high VIX suggests investor fear, while a low VIX indicates confidence. This can help you understand the overall market mood.
- Options Trading: This can be a valuable tool for options traders to decide whether to buy or sell options contracts.
- Trading Volatility: Advanced traders can use it to directly trade on market volatility.
- Predicting Market Trends: The VIX often peaks before market downturns and bottoms before market upswings, providing insights for index trading.
- Portfolio Management: Mutual fund and portfolio managers can use it to adjust their holdings based on expected volatility.
India VIX and Market Sentiment:
Imagine the stock market is a big party. Sometimes it's a chill hangout with everyone relaxed (low VIX), and other times it's a wild dance party with people jumping everywhere (high VIX). The India VIX helps you guess what kind of party it'll be.
Low VIX
- Investors are happy to buy and hold stocks because they think prices will stay the same or go up slowly.
- Example: VIX is at 12%. Investors might buy stocks hoping they'll grow in value over time, because there's less risk of big drops.
High VIX
- Investors are worried about what will happen next and might not want to buy stocks. They might even sell their stocks to avoid losing money.
- Example: VIX jumps to 30%. Investors are scared! They might put their money in safer places like bonds, where prices are less likely to swing wildly.
The key thing to remember:
The VIX is a hint, not a mind reader. It tells you what investors are generally feeling, but it's not perfect. Feelings can change fast in the market. Look at other things too to get the whole picture.
Conclusion
India VIX serves as a powerful tool to gauge market sentiment and expected volatility, helping traders and investors make informed decisions. A low VIX indicates stability, while a high VIX signals uncertainty and risk. Though not foolproof, it complements other analysis techniques, offering valuable insights for managing risk, trading options, and understanding market trends. By leveraging India VIX, you can better navigate the rollercoaster of the stock market.


.webp)
.webp)

.webp)


START YOUR INVESTMENT JOURNEY
Get personalized advice from our experts
- Dedicated RM Support
- Smooth and Fast Trading App
