The Power of Compounding – Why Starting Early Matters


Introduction
Albert Einstein reportedly called compound interest the "eighth wonder of the world." Whether or not he actually said it, the math is undeniable. Compounding is the process where your investment returns begin earning their own returns — and over time, this snowball effect becomes truly extraordinary.
The catch? Compounding needs one essential ingredient: time.
The more years you give your money to grow, the more dramatic — and life-changing — the results become. This is exactly why starting your investment journey early, even with a modest amount, can make a difference of crores by the time you retire.
A Tale of Two Investors: Arjun vs Priya
Let's bring this concept to life with a simple, real-world example.
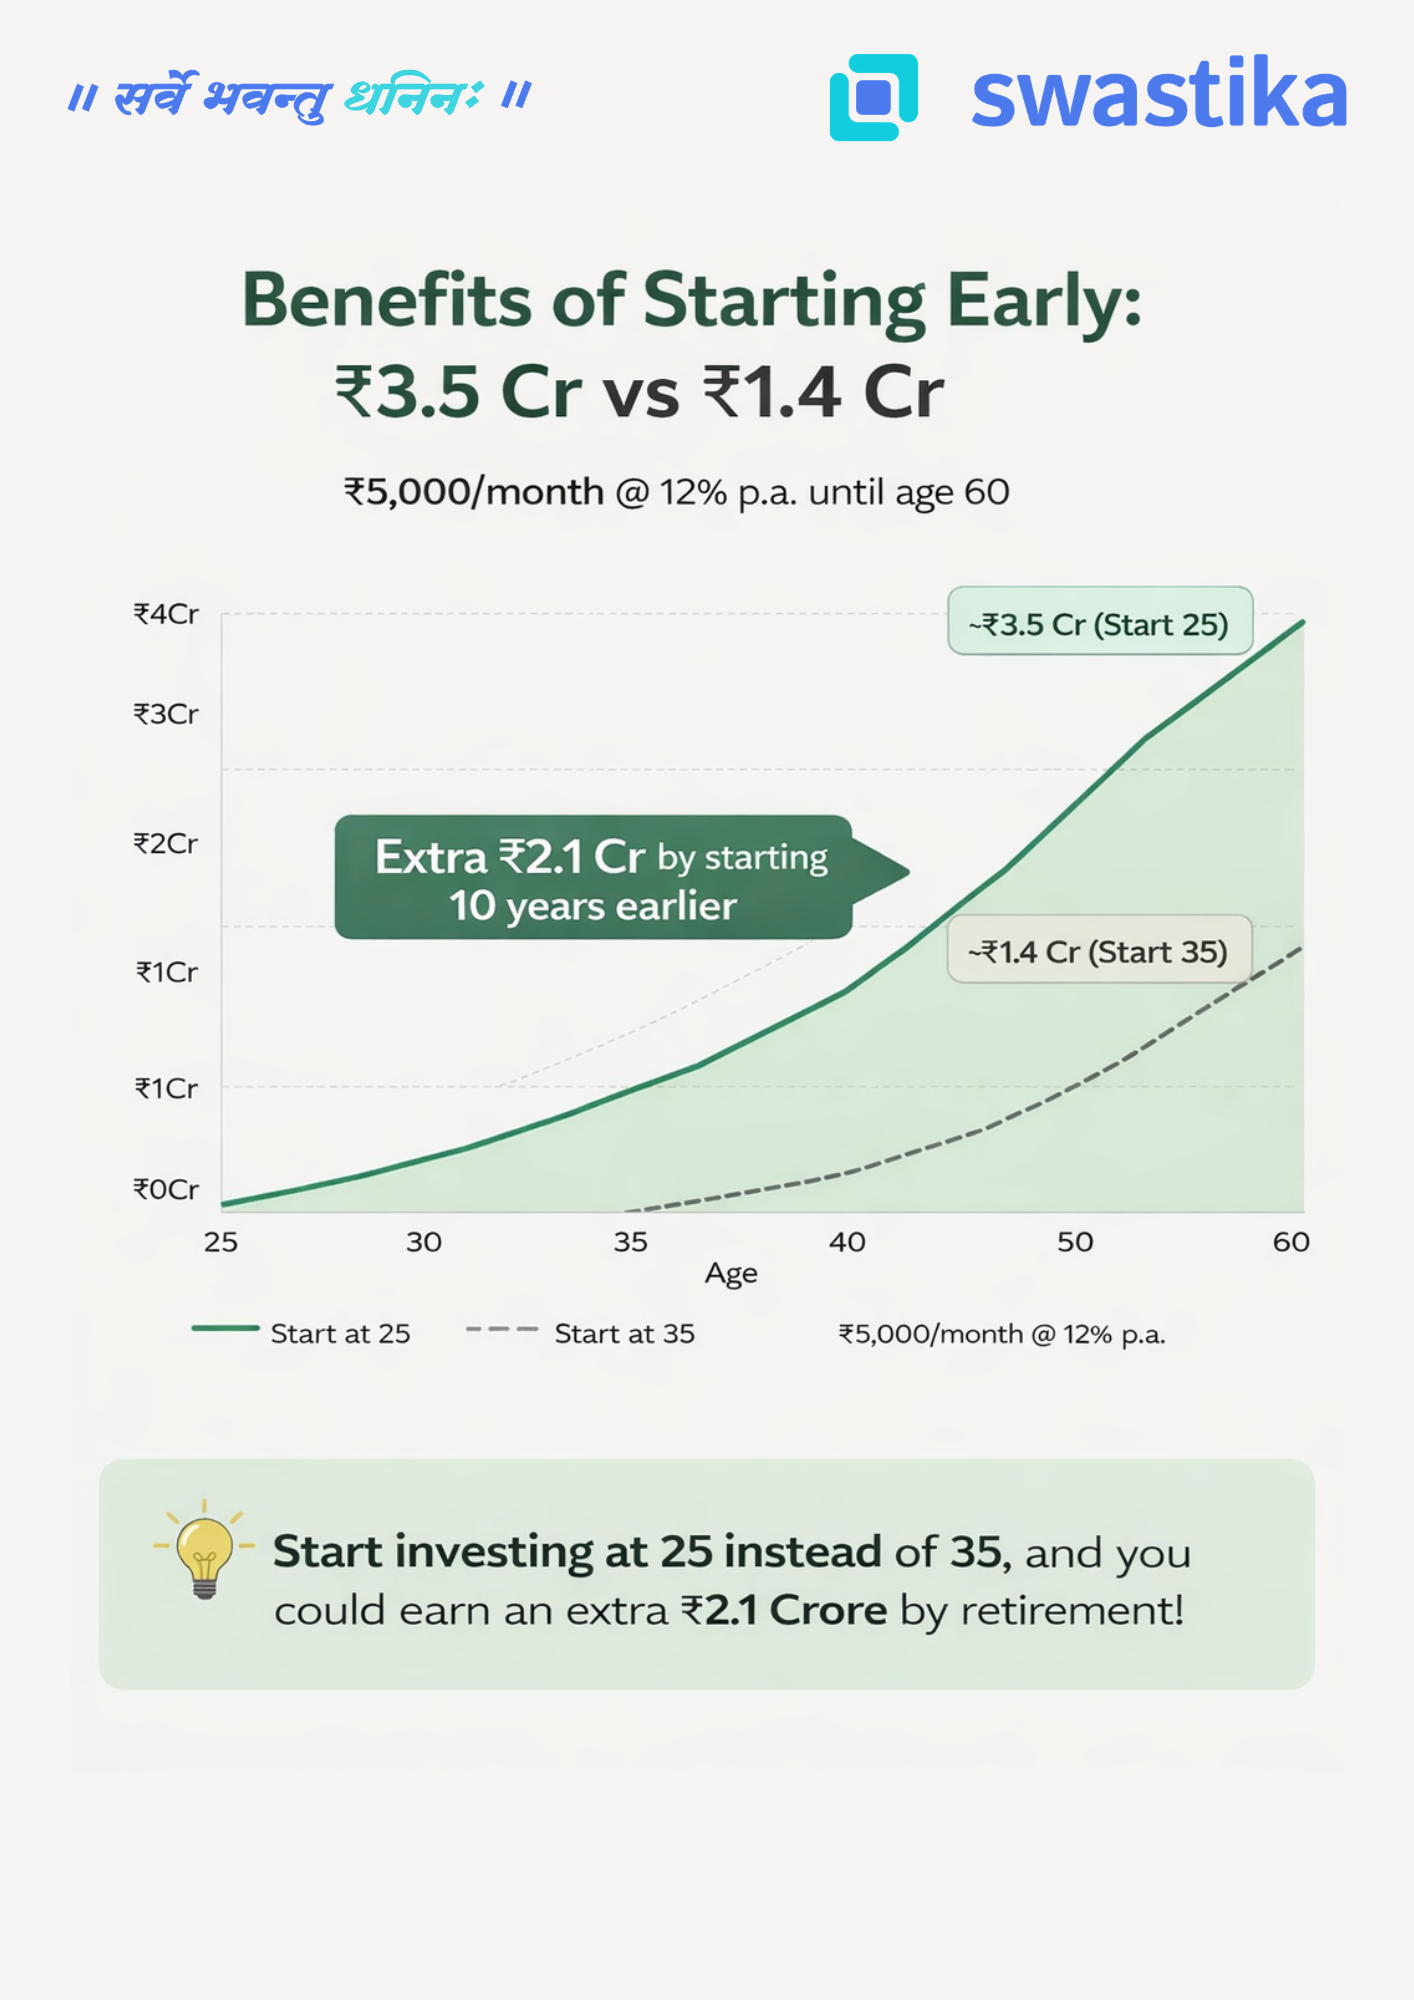
Meet Arjun and Priya. Both are sensible, disciplined investors. Both invest ₹5,000 every month through a SIP (Systematic Investment Plan) in equity mutual funds, earning an average annual return of 12%. Both stop investing at age 60.
The only difference? Arjun starts at 25. Priya starts at 35.
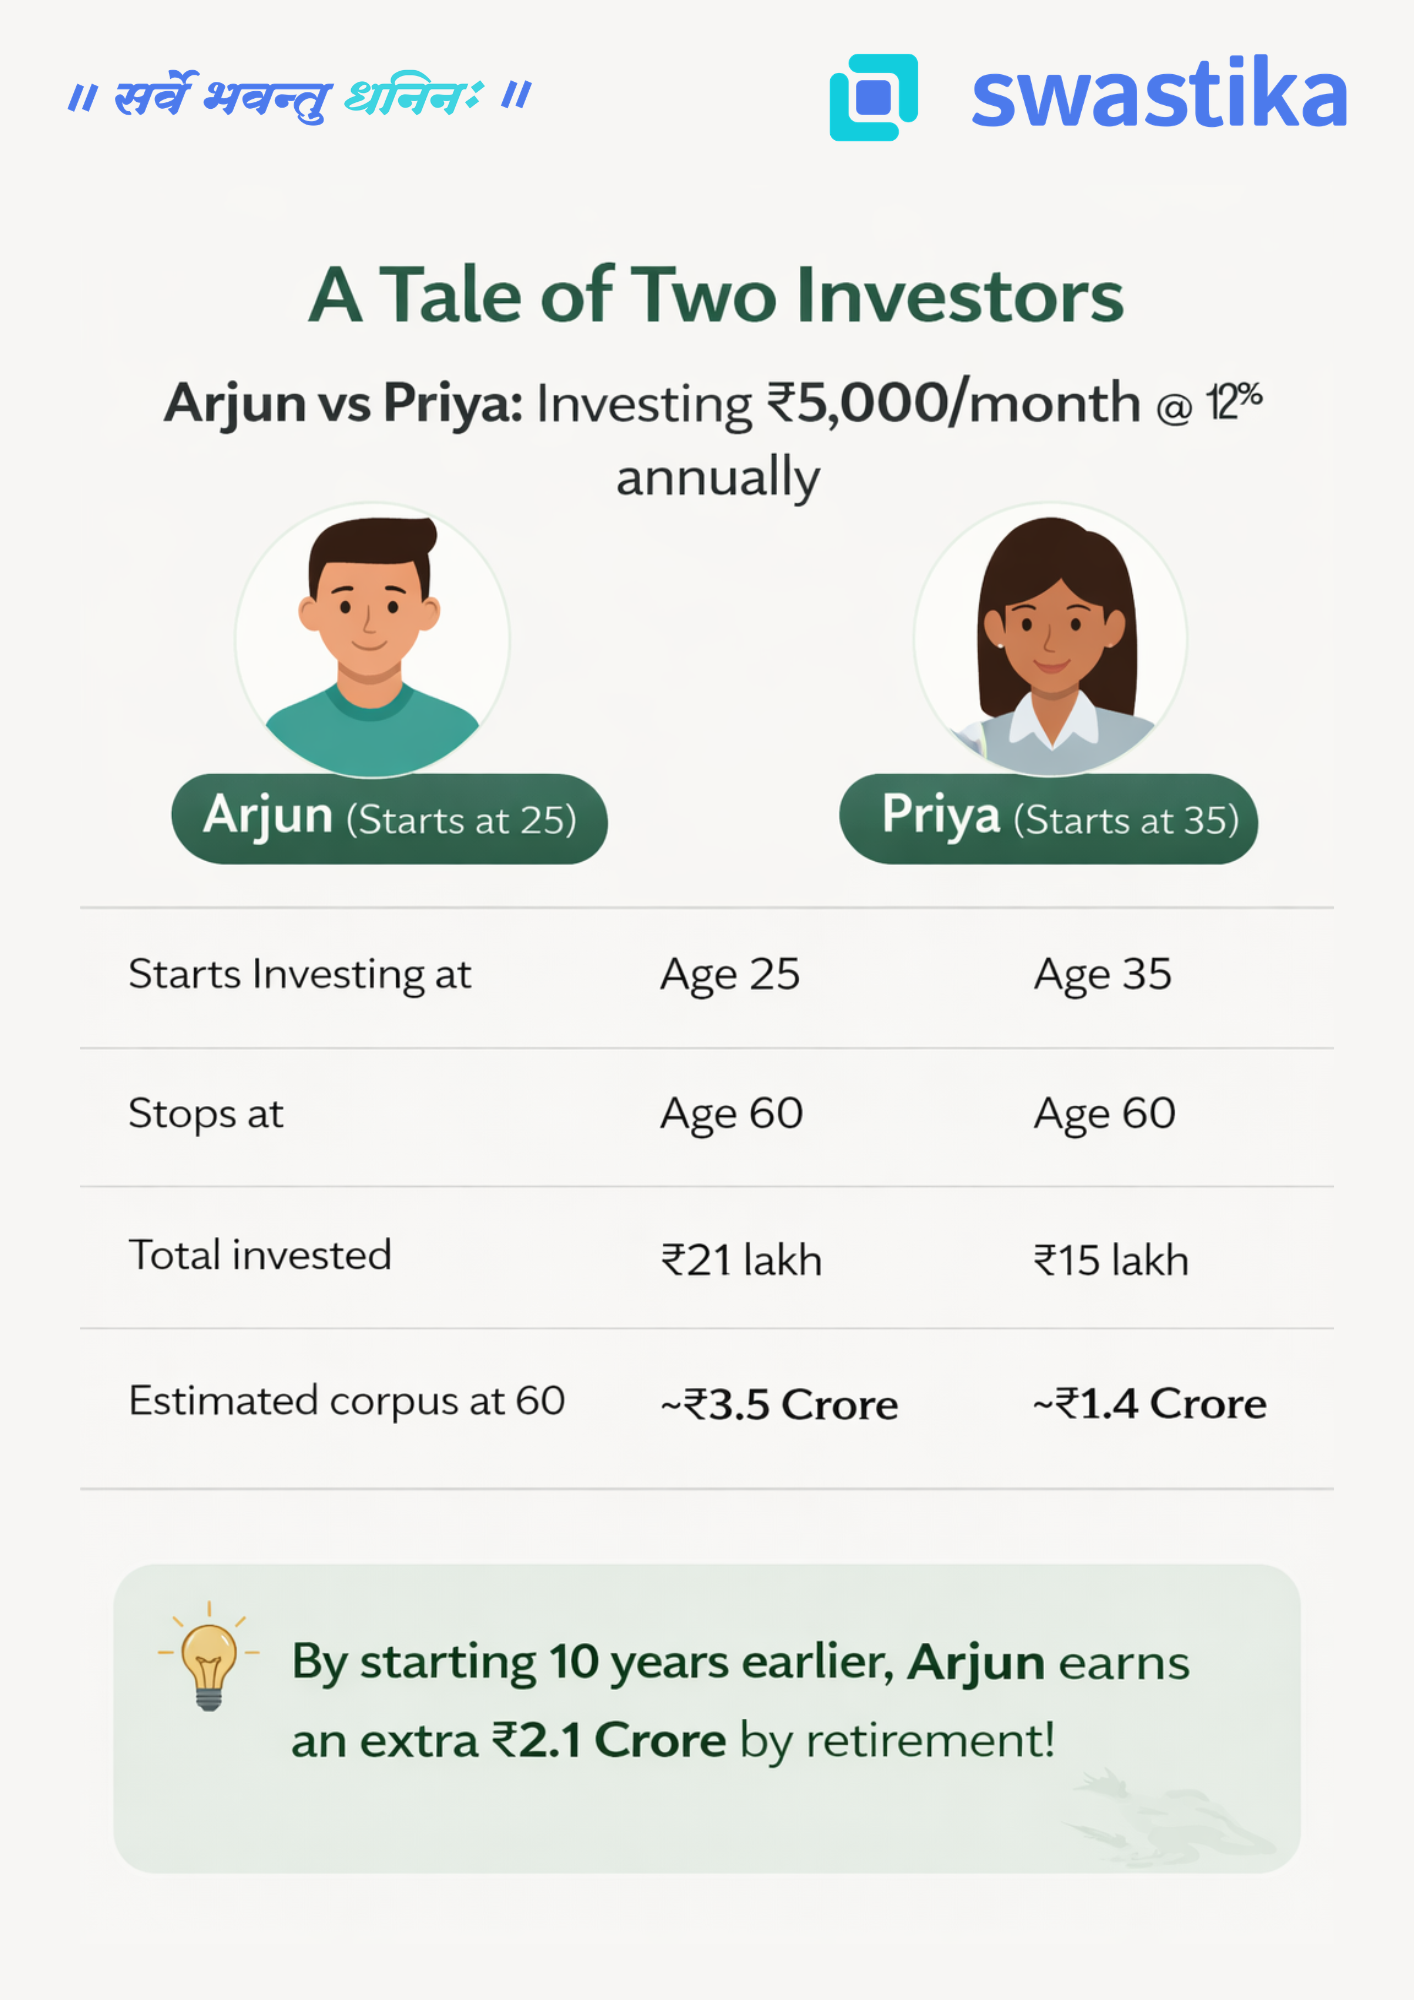
The numbers are striking. Arjun invests just ₹6 lakh more than Priya in absolute terms — yet walks away with ₹2.1 Crore more at retirement.
That extra ₹2.1 Crore didn't come from investing more aggressively or taking bigger risks. It came purely from starting 10 years earlier.
Why Does Time Make Such a Huge Difference?
This is where the magic of compounding reveals itself.
In the early years of investing, growth looks modest and almost unimpressive. But as the years pass, your corpus grows not just on your original investment, but on all the accumulated returns from previous years. The curve goes from almost flat to steeply exponential — and that steep climb happens in the later years.
When Arjun starts at 25, his money has 35 years to ride that exponential curve. Priya's money, starting at 35, only catches the last 25 years — and critically, it misses the steepest part of the climb in the final decade.
Think of it this way: the last 10 years of compounding are worth more than the first 20. That is the counterintuitive truth at the heart of long-term investing.
The Real Cost of Waiting
Many young earners tell themselves, "I'll start investing once I'm more settled — once the salary improves, once the EMI is paid off, once life is a bit easier."
But the numbers show that every year of delay is extraordinarily expensive — far more expensive than any EMI or lifestyle expense. Priya didn't invest carelessly. She invested faithfully for 25 years. Yet she ends up with less than half of what Arjun accumulated — not because she did anything wrong, but simply because she started a decade late.
The cost of waiting 10 years wasn't ₹6 lakh in additional contributions. The cost was ₹2.1 Crore in lost wealth.
Three Principles to Remember
1. Start now, not later.The best time to start investing was yesterday. The second best time is today. Even a SIP of ₹1,000–₹2,000 per month in your 20s is infinitely better than waiting for the "right time."
2. Consistency beats intensity.You don't need to invest large sums all at once. A small, steady, monthly commitment — maintained without interruption — is what unlocks the full power of compounding over decades.
3. Stay invested through market cycles.Compounding works only if you let it work. Exiting during market corrections or stopping your SIP in tough months breaks the chain. Time in the market, not timing the market, is what builds wealth.
The Bottom Line
If you are in your 20s or early 30s, you hold an asset that no amount of money can buy later: time. Use it. Start a SIP today — even a small one. Let compounding do its slow, steady, powerful work.
Because the difference between starting at 25 and starting at 35 is not just 10 years. As Arjun and Priya's story shows, that difference is ₹2.1 Crore.
Big Budget


.webp)
.webp)
.webp)
.webp)
.webp)


.webp)
.webp)
.webp)
.webp)
Latest Articles

सतर्क रहें, फर्जी गतिविधियों से सावधान!


सतर्कता सूचना:
प्रिय निवेशक,
हम आपको सूचित करना चाहते हैं कि कुछ व्यक्ति अपने आप को विभिन्न स्टॉक ब्रोकर्स के कर्मचारियों के रूप में बता कर निवेशकों को फर्जी कॉल करके उन्हें लुभावने ऑफर देकर व्हाट्सएप/टेलीग्राम चैनल में शामिल होने के लिए कहते हैं और उनसे अपने व्यक्तिगत खाते में पैसे भेजने के लिए कहते हैं। अगर आपको "स्वस्तिका" के नाम से ऐसे किसी भी फर्जी व्यक्ति की कॉल मिलती है, तो कृपया उनके खिलाफ सतर्क रहें और हमारे आधिकारिक चैनलों के माध्यम से संचार की पुष्टि करें। किसी भी प्रतिनिधि से व्यक्तिगत खातों में कोई लेन देन ना करें । यदि निवेशक ऐसे फर्जी व्यक्तियों के साथ कोई भी लेनदेन करते हैं, तो "सेबी" और "एक्सचेंज" के नियमों के अनुसार स्टॉक ब्रोकर उस हानि के लिए जिम्मेदार नहीं होगा।
कृपया सतर्क रहें।
यदि आपको कोई भी ऐसा कॉल आए या आप धोखाधड़ी का शिकार बने हैं तो नीचे दिए गए लिंक पर शिकायत दर्ज करें:
https://cybercrime.gov.in/Webform/Crime_AuthoLogin.aspx
अधिक जानकारी के लिए यह यूट्यूब वीडियो देखें।
.webp)
A simple options trading guide
Options trading can seem difficult at first, but it’s a powerful way to take control of your financial investments. This guide is designed to break down the fundamentals of options trading, making it easy for you to understand key concepts and strategies, so you can start trading with confidence
Introduction
Options trading involves buying and selling contracts that give you the right, but not the obligation, to buy or sell an underlying asset, such as stocks, at a predetermined price (strike price) before a certain date (expiration date). Options are valuable because they offer the potential for high returns and can help protect your investments against market risks.
3 Important Things to Know
1. Time Decay (Theta)
Time decay refers to the decrease in value of an options contract as it approaches its expiration date. Its value diminishes as time passes. As an option gets closer to expiration, its value decreases even if the underlying stock's price remains the same.
Tip: Time decay is your friend if you are an option seller.
You purchase an option for ₹1,000 with one month left until expiration. After two weeks, due to time decay, the option's value might drop to ₹600.
2. Volatility (Vega)
Explanation: Volatility measures how much the price of the underlying asset fluctuates. High volatility typically increases the value of options because there’s a greater chance that the option could become profitable.
If a stock’s price is usually stable, an option might cost ₹200. However, if there's news expected to cause significant price movement, the same option could increase to ₹500.
3. Risk-Reward Ratio
Explanation: This ratio compares the potential profit of a trade to the potential loss. A favorable ratio means the potential profit outweighs the risk involved.
If you risk ₹500 on an option and stand to earn ₹2,000, your risk-reward ratio is 1:4, indicating a good trading opportunity.
Strike Price and Expiration
- Strike Price: The price at which you can buy or sell the asset if you exercise the option. If you have a call option with a strike price of ₹500 and the stock rises to ₹600, you can buy the stock at ₹500, potentially earning ₹100 per share.
- Expiration Date: The last day on which you can exercise the option. After this date, the option becomes worthless. If your option expires on September 30th and you haven’t used it, you lose the premium paid for the option.
Call Options and Put Options
Call Options
A call option gives the buyer the right to buy an underlying asset at the strike price before the expiration date. This is a bullish strategy, suitable for traders who believe the underlying asset's price will increase.
- You expect a stock to rise from ₹300 to ₹400. You buy a call option with a strike price of ₹350. If the stock reaches ₹400, you can exercise the option and buy the stock at ₹350, then sell it in the market for ₹400, making a profit of ₹50 per share.
- Profit Potential: Unlimited.
- Risk: Limited to the premium paid for the option.
Put Options
A put option gives the buyer the right to sell an underlying asset at the strike price before the expiration date. This is a bearish strategy, suitable for traders who believe the underlying asset's price will decrease.
- You expect a stock to fall from ₹200 to ₹100. You buy a put option with a strike price of ₹180. If the stock falls to ₹100, you can exercise the option and sell the stock at ₹180, even though the market price is only ₹100, making a profit of ₹80 per share.
- Profit Potential: Limited to the strike price minus the premium paid.
- Risk: Limited to the premium paid for the option.

Effortless Trading: Algorithmic Solutions for the Indian Stock Market
Imagine having a robot that can buy and sell stocks for you while you sit back and relax. That's the power of algorithmic trading!
What is Algorithmic Trading?
Traditionally, stock trading involves manually placing orders based on your analysis. Algorithmic trading takes the "manual" out of the equation. Algorithmic trading, also known as algo trading or automated trading, involves using computer algorithms to execute trades in the stock market. These algorithms are programmed to follow specific rules and criteria, such as price, volume, or timing, to make trading decisions automatically.
How Does Algorithmic Trading Work?
Algorithmic trading works by using predefined rules and parameters to analyze market data and execute trades without human intervention. These algorithms can process large amounts of data at high speeds, allowing for rapid decision-making and execution of trades. No more refreshing screens and panicking over every price swing.
Benefits of Algo Trading:
- Speed: Algorithms can execute trades in milliseconds, much faster than human traders, allowing for timely execution of trading strategies.
- Accuracy: Algorithmic trading eliminates human error and emotional bias, ensuring trades are executed based on predefined criteria and rules.
- Efficiency: Algorithms can monitor multiple markets, securities, and indicators simultaneously, optimizing trading opportunities and efficiency.
- Discipline: Algo trading follows predefined rules and parameters, maintaining discipline and consistency in trading strategies.
- Diversification: Algorithmic trading allows for diversification across multiple strategies, markets, and securities, reducing risk and enhancing portfolio performance.
Understanding Key Terms:
- Technical Indicators: These are mathematical calculations used to analyze price charts and identify potential trading signals. Common examples include moving averages, Relative Strength Index (RSI), and Bollinger Bands.
- Order Types: These define how your algo interacts with the market. Common order types include market orders (immediate execution at best available price) and limit orders (execution only at a specific price or better).
- Backtesting: As mentioned earlier, this involves testing your algo's performance on historical data to assess its effectiveness and identify areas for improvement.
Popular Algo Trading Strategies for Beginners in India:
1. Moving Average Crossover:
This is a trend-following strategy that uses two moving averages (like 50-day and 200-day) to identify potential entry and exit points.
- Logic: When the shorter moving average crosses above the longer one, it might signal an uptrend. Conversely, a crossover below could indicate a downtrend.
- Example: Let's say you're considering buying shares of Reliance (RIL) using a 50-day and 200-day moving average crossover strategy. If the 50-day average moves above the 200-day average, your algo might trigger a buy order for RIL at ₹2,500. You would also set a stop-loss order (an automatic sell order to limit losses) below a certain price point, say ₹2,300.
2. Relative Strength Index (RSI):
The RSI measures the momentum of a stock's price movement. It ranges from 0 to 100, with values below 30 indicating oversold conditions (potentially a buying opportunity) and values above 70 suggesting overbought conditions (potentially a selling opportunity).
- Logic: Your algo can be programmed to buy a stock when the RSI dips below 30 and sell when it climbs above 70. This strategy attempts to capitalize on potential reversals in price trends.
- Example: You're tracking Infosys (INFY) and notice its RSI falls to 28. Based on your RSI-based algo strategy, you might receive a buy signal for INFY at ₹1,400. You would again set a stop-loss order to manage potential downside risk.
3. Statistical Arbitrage:
This strategy exploits tiny price discrepancies between similar assets in different markets. Imagine buying a stock on the National Stock Exchange (NSE) at a slightly lower price than its being sold on the Bombay Stock Exchange (BSE). The algo would capitalize on this momentary inefficiency by executing a buy order on the NSE and a sell order on the BSE, pocketing the miniscule difference.
- Logic: This strategy relies on complex statistical models and high-frequency trading to identify and exploit fleeting price differences.
- Things to Consider: Statistical arbitrage involves significant capital and sophisticated algorithms. It's best suited for experienced traders with access to advanced trading platforms.
4. Mean Reversion Strategy:
This strategy bets on the idea that prices eventually revert to their historical averages. When a stock's price deviates significantly from its long-term average, the algo identifies it as a potential buying or selling opportunity.
- Logic: The algo might be programmed to buy a stock that has fallen well below its historical average and sell it when it rises above a certain threshold. This strategy attempts to profit from price corrections in the market.
- Example: Let's say you're following a mean reversion strategy for Tata Motors (TTM). If TTM's price plunges 20% below its 52-week average, your algo might trigger a buy order. Conversely, a surge 15% above the average could prompt a sell signal.
5. Volume-Weighted Average Price (VWAP) Trading:
This strategy aims to achieve the average price of a stock over a specific timeframe throughout the trading day. It factors in both price and volume to execute orders gradually.
- Logic: Instead of buying all your desired shares at once, the algo might distribute the purchase throughout the day, buying smaller quantities at different price points based on prevailing volume. This approach aims to minimize the impact of market volatility on your average purchase price.
- Benefits: VWAP trading helps mitigate the risk of buying at an inflated price during a sudden surge. It also avoids putting a large buy order that could move the price against you.
Remember: These are just a few examples. The world of algo trading offers a vast array of strategies, each with its own complexities and risk-reward profile.
How to Get Started with Algorithmic Trading in India:
- Educate Yourself: Learn the basics of algorithmic trading, including terminology, strategies, and risk management principles.
- Choose a Platform: Select a reliable trading platform or broker like Swastika Investmart which offers algorithmic trading capabilities and access to Indian stock markets.
- Develop a Strategy: Define your trading strategy and parameters, including entry and exit criteria, risk tolerance, and position sizing.
- Backtest Your Strategy: Use historical data to backtest your trading strategy and evaluate its performance under various market conditions.
- Monitor and Optimize: Continuously monitor the performance of your algorithmic trading strategy and make adjustments as needed to improve results.
Risks of Algorithmic Trading:
- Technical Failures: Algorithmic trading systems are susceptible to technical glitches, downtime, or errors, which can lead to losses or missed opportunities.
- Market Volatility: Rapid market fluctuations and unexpected events can trigger algorithmic trading systems to execute trades that may result in losses.
- Over-Optimization: Over-optimizing trading strategies based on historical data can lead to poor performance in live market conditions.
Conclusion:
Algorithmic trading offers an exciting opportunity to automate and optimize your trading activities in the Indian stock market. By understanding the basics, developing a sound strategy, and leveraging technology, you can harness the power of algorithmic trading to enhance your trading experience and potentially improve investment returns.

Navigating the Stock Market: Traditional Investing vs. Algo Trading
Algo Trading vs. Traditional Investing: What's the Difference?
Ever felt like the stock market moves faster than you can keep up? You're not alone! While the stock market offers great opportunities, constantly watching and making decisions can be tough.
This is where algo trading comes in. Imagine having a super-powered assistant who follows your instructions and trades automatically. Sounds cool, right? But is it the right fit for you? Let's break down algo trading and compare it to the tried-and-tested method – traditional investing – to see which one suits you better.
What is Traditional Investing?
Traditional trading refers to the buying and selling of financial assets such as stocks, bonds, currencies, or commodities through established exchanges or markets using conventional methods. In traditional trading, investors typically place orders through brokers, who execute these orders on their behalf on centralized exchanges. The goal of traditional trading is often to buy assets at a lower price and sell them at a higher price to make a profit. This approach usually involves holding onto assets for a longer period, with the intention of capitalizing on market trends and economic conditions.
Pros of traditional trading:
- Control: Traditional trading allows traders to have direct control over their investment decisions, including when to buy or sell assets.
- Flexibility: Traders have the flexibility to adjust their trading strategies based on market conditions, news events, or personal preferences.
- Fundamental Analysis: Traditional trading often involves fundamental analysis, which focuses on analyzing company financials, industry trends, and economic factors to make investment decisions.
- Diversification: Traders can diversify their investment portfolios across various asset classes, sectors, or geographic regions to manage risk and optimize returns.
- Lower barrier to entry: No fancy coding knowledge is required. You can start with a basic trading platform and some research.
Cons of traditional trading:
- Time-consuming: Traditional trading requires significant time and effort to conduct research, analyze market trends, and monitor investments, which can be challenging for busy individuals.
- Limited Speed: Traditional trading methods, such as placing orders through a broker or using manual trading platforms, may result in slower execution speeds compared to automated trading systems.
- Human Error: Traditional trading is susceptible to human error, including mistakes in trade execution, misinterpretation of market data, or emotional biases that can impact decision-making.
Traditional trading contrasts with newer forms of trading, such as high-frequency trading or algorithmic trading, which rely on advanced technology and rapid execution strategies.
What is Algo Trading (Algorithmic Trading)?
Algorithmic trading often referred to as algo trading, is a method of executing trades using automated, pre-programmed trading instructions. In algo trading, computer algorithms analyze market data, such as price movements, volume, and other indicators, to generate buy or sell signals. These algorithms are designed to execute trades automatically based on specific criteria, such as timing, price, or quantity.
Algo trading can be used in various financial markets, including stocks, bonds, currencies, commodities, and derivatives. It allows for rapid execution of trades and can process large volumes of orders with minimal human intervention.
The primary goals of algo trading are to reduce transaction costs, minimize market impact, and maximize trading efficiency. By removing human emotions and biases from the trading process, algo trading aims to achieve consistent and disciplined trading results.
Overall, algo trading has become increasingly popular among institutional investors, hedge funds, and professional traders due to its potential for enhancing trading performance and risk management capabilities.
Pros of Algo Trading:
- Speed: Algo trading allows for rapid execution of trades, enabling traders to take advantage of market opportunities as soon as they arise.
- Efficiency: Automated algorithms can process large volumes of trades with minimal human intervention, leading to increased efficiency in trading operations.
- Accuracy: Algo trading eliminates the potential for human error in trade execution, ensuring that trades are executed according to pre-defined parameters.
- Consistency: Algorithms adhere strictly to predefined trading rules, helping to maintain consistency in trading decisions and strategies over time.
- Backtesting: Algo trading strategies can be backtested using historical market data to assess their performance before deployment in live trading, allowing traders to refine and optimize their strategies.
Cons of Algo Trading:
- Technical Issues: Algo trading systems are susceptible to technical glitches, such as system failures, connectivity issues, or software bugs, which can lead to execution errors or losses.
- Regulatory Risks: Algo trading is subject to regulatory oversight, and changes in regulations or compliance requirements may impact the operation of algo trading systems and strategies.
- Black Box Risk: If the algo goes awry, it can be difficult to understand why and fix it quickly. Think of it like a fancy car – great for performance, but requires more maintenance.
- Limited Adaptability: Markets are unpredictable, and unforeseen events can throw your algo off course.
Key Differences:
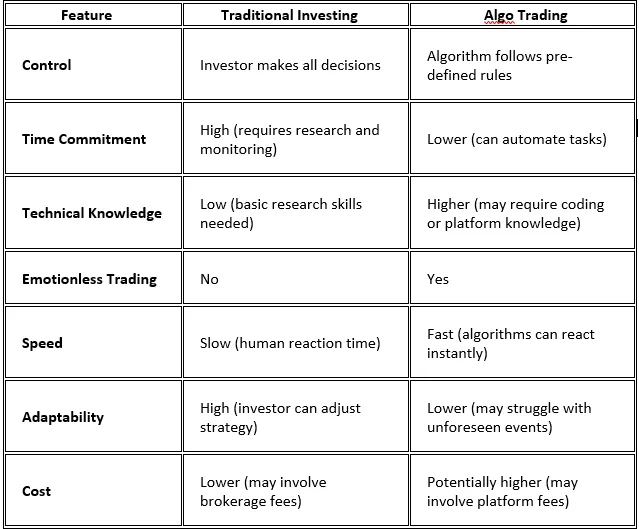
Choosing Your Path:
Now that you know the differences between traditional investing and algo trading, how do you decide which one is right for you? Here are a few things to consider:
- Your Goals: Think about what you want to achieve with your investments. Are you looking for long-term growth, or do you want to make quick profits? Traditional investing might be better for long-term goals, while algo trading could suit those looking for faster returns.
- Your Skills: Consider your strengths and weaknesses. If you're good with numbers and technology, algo trading might be a good fit. But if you prefer a simpler approach and don’t want to deal with computers, traditional investing could be the way to go.
- Your Risk Tolerance: How comfortable are you with taking risks? Algo trading can be more volatile and unpredictable, while traditional investing tends to be more stable over time. Make sure you’re okay with the ups and downs of your chosen path.
- Your Resources: Do you have the time, money, and knowledge to invest in algo trading? It can require more upfront investment in terms of time and learning, as well as financial resources for software and tools. Traditional investing may be more accessible for beginners with limited resources.
- You’re Interest: Which approach sounds more appealing to you? If you enjoy analysing data and testing strategies, algo trading might be exciting. But if you prefer a hands-off approach and want to focus on other things, traditional investing could be a better fit.
Conclusion:
In the end, there’s no one-size-fits-all answer when it comes to choosing between traditional investing and algo trading. Both approaches have their own merits and challenges, and the right choice depends on your individual circumstances and preferences.
Whether you’re drawn to the simplicity and stability of traditional investing or the speed and potential of algo trading, the key is to do your research, understand the risks involved, and stay true to your investment goals. By carefully considering your options and making informed decisions, you can embark on a path that aligns with your financial aspirations and helps you build wealth over time.
So, whether you’re a tortoise or a hare in the race to financial success, remember that the journey is just as important as the destination.
Happy investing!

The Role of Stock Market Calculators
Introduction:
Investing in the stock market can be both exciting and daunting, especially for beginners. With so many variables to consider, making informed investment decisions is crucial. Thankfully, stock market calculators are powerful tools that can simplify the process and help investors plan their investments effectively. In this blog, we'll explore the importance of stock market calculators in investment planning, how they work, and why every investor should incorporate them into their financial toolkit.
Understanding Stock Market Calculators:
Stock market calculators are online tools designed to perform various calculations related to stock investments. They can help investors analyze potential returns, assess risks, and make informed decisions about buying, selling, or holding stocks. These calculators utilize mathematical formulas and historical data to provide users with valuable insights into their investment portfolios.
Types of Stock Market Calculators:
There are several types of stock market calculators available, each serving a specific purpose in investment planning:
- SIP Calculator: SIP stands for Systematic Investment Plan. This calculator helps you figure out how much money you can accumulate over time by regularly investing a fixed amount in mutual funds or other investment schemes.
For example, if you invest Rs.1000 every month for 10 years, the calculator will tell you how much your investment could grow over the time.
- Lumpsum Calculator: This calculator helps you calculate the future value of a lump sum investment (a one-time investment) based on factors like the investment amount, interest rate, and time period.
- Mutual Fund Calculator: This calculator helps you understand the potential returns from investing in mutual funds. It calculates the growth of your investment based on factors like investment amount, time frame, and expected rate of return. For example, if you invest Rs.5,000 in a mutual fund with an expected rate of return of 10% per year, the calculator will show you how much your investment could be worth in 5, 10, or even 20 years.
- PPF Calculator: PPF stands for Public Provident Fund. This calculator helps you estimate the maturity amount of your PPF investment over time, taking into account factors like the investment amount, interest rate, and tenure.
- FD Calculator: FD stands for Fixed Deposit. This calculator helps you determine the maturity amount of your fixed deposit investment based on factors like the deposit amount, interest rate, and tenure.
- RD Calculator: RD stands for Recurring Deposit. This calculator helps you calculate the maturity amount of your recurring deposit investment, where you deposit a fixed amount regularly over a specified period.
- EMI Calculator: EMI stands for Equated Monthly Installment. This calculator helps you calculate the monthly installment amount for a loan, taking into account factors like the loan amount, interest rate, and tenure.
- Simple Interest Calculator: This calculator helps you compute the interest earned or paid on a principal amount, where the interest is calculated only on the initial investment without considering any additional interest on accumulated interest.
- Future Value Calculator: This calculator helps you determine the future value of an investment based on factors like the initial investment amount, interest rate, and time period. For example, if you invest Rs.10,000 today at an interest rate of 7% for 10 years, the calculator will tell you how much your investment could grow to by the end of those 10 years.
- Compound Interest Calculator: This calculator helps you calculate the future value of an investment with compound interest, where interest is earned not only on the initial investment but also on the accumulated interest. For example, if you invest Rs.10,000 at an interest rate of 6% compounded annually for 5 years, the calculator will show you how much your investment could grow to by the end of those 5 years.
- Dividend Yield Calculator: This calculator helps you calculate the dividend yield of a stock, which is the ratio of dividend paid per share to the stock's current market price, expressed as a percentage. For example, if a stock pays a dividend of Rs.20 per share and its current market price is Rs.100 per share, the calculator will show you the dividend yield as a percentage.
- Gratuity Calculator: This calculator helps you estimate the gratuity amount you're eligible to receive based on your years of service and last drawn salary, as per the Gratuity Act.
- GST Calculator: This calculator helps you calculate the amount of Goods and Services Tax (GST) payable on a transaction based on the GST rate and the value of goods or services.
- ELSS Calculator: ELSS stands for Equity Linked Savings Scheme. This calculator helps you estimate the potential returns from investing in ELSS mutual funds, which offer tax benefits under Section 80C of the Income Tax Act.
- Span Margin Calculator: This calculator helps you calculate the margin required for trading futures and options contracts, taking into account factors like the contract value, margin percentage, and volatility. For example, if you're trading futures contracts with a contract value of Rs.1,00,000 and a margin percentage of 5%, the calculator will tell you how much margin you need to maintain in your trading account. This ensures that you have enough funds to cover potential losses and meet exchange requirements.
Importance of Stock Market Calculators:
Stock market calculators play a crucial role in investment planning for several reasons:
- Decision Making: By providing accurate and reliable calculations, stock market calculators empower investors to make best decisions about their investments.
- Risk Management: Calculators help investors assess the risk associated with different investment options and develop strategies to reduce risk effectively.
- Goal Setting: Calculators enable investors to set realistic investment goals and track their progress over time. Whether it's saving for retirement, buying a house, or funding a child's education, calculators help investors stay focused on their objectives.
- Portfolio Optimization: With the help of calculators, investors can optimize their investment portfolios to achieve the desired balance of risk and return. By diversifying across asset classes and adjusting allocation percentages, investors can maximize their portfolio's potential for growth while minimizing risk.
- Understanding Investment Products: Stock market calculators provide investors with valuable insights into various investment products, such as stocks, bonds, mutual funds, and exchange-traded funds (ETFs). By analyzing performance metrics, assessing fees and expenses, and comparing investment options, investors can make more smart choices that suit their investment objectives and preferences.
In conclusion, stock market calculators are essential tools for investors at every stage of their investment journey. Whether you're a beginner or an experienced investor, incorporating these calculators into your investment planning process can help you make smarter decisions, manage risk effectively, and achieve your financial goals.
So, next time you're considering an investment opportunity, don't forget to leverage the power of stock market calculators to make informed and strategic investment decisions.
Happy investing!

A Comprehensive Guide to Choosing the Best Mutual Fund Investments
Introduction:
Investing in mutual funds can be a game-changer in your financial journey. It offers a diversified portfolio managed by professionals, making it an attractive option for both seasoned investors and beginners alike. However, with so many mutual fund options available in the Indian market, selecting the right ones can be very difficult.
Understanding Mutual Funds:
Before diving into the selection process, let's understand the basics of mutual funds. A mutual fund pools money from numerous investors to invest in a diversified portfolio of stocks, bonds, or other securities. These funds are managed by experienced fund managers who make investment decisions based on the fund's objectives.
Types of Mutual Funds:
Mutual funds come in various types, each catering to different investment objectives and risk profiles.
- Equity Funds: These funds primarily invest in stocks, aiming for capital appreciation over the long term. They offer higher potential returns but come with increased volatility.
- Debt Funds: Debt funds invest in fixed-income securities like government bonds, corporate bonds, and treasury bills. They are relatively less risky than equity funds and provide stable returns.
- Hybrid Funds: Also known as balanced funds, hybrid funds invest in a mix of equities and debt instruments to balance risk and return. They offer diversification and are suitable for investors seeking a balanced portfolio.
- Index Funds: Index funds replicate the performance of a specific market index like the Nifty 50 or Sensex. They aim to match the returns of the index they track and typically have lower expense ratios.
- Sector Funds: Sector funds focus on specific sectors like technology, healthcare, or banking. They offer the opportunity to invest in a particular industry but come with higher sector-specific risks.
- Tax-saving Funds (ELSS): Equity Linked Savings Schemes (ELSS) are tax-saving mutual funds that offer tax benefits under Section 80C of the Income Tax Act. They have a lock-in period of three years and primarily invest in equities.
Assessing Your Risk Tolerance:
Before selecting mutual funds, it's crucial to assess your risk tolerance. Your risk tolerance is influenced by factors like your investment goals, time horizon, and financial situation. Here's a simple risk assessment to help you gauge your risk appetite:

Once you determine your risk tolerance level, you can align it with suitable mutual fund categories. For example, if you have a long-term investment horizon and a high risk tolerance, equity funds may be suitable for you.
Analyzing Fund Performance:
Past performance is often considered an essential factor in selecting mutual funds. While historical performance doesn't guarantee future results, it provides insights into how the fund has performed in different market conditions. When analyzing fund performance, consider the following metrics:
- Annualized Returns: Look at the fund's annualized returns over different time periods (1-year, 3-year, 5-year, and since inception). Compare the fund's performance against its benchmark index and peers in the same category.
- Risk-adjusted Returns: Assess the fund's risk-adjusted returns using measures like Sharpe Ratio and Sortino Ratio. These ratios consider both returns and volatility, providing a more comprehensive view of performance.
- Expense Ratio: Pay attention to the fund's expense ratio, which represents the annual fees charged by the fund house for managing the fund. Lower expense ratios translate to higher returns for investors.
- Portfolio Composition: Evaluate the fund's portfolio holdings to understand its asset allocation, sector exposure, and top holdings. Ensure that the fund's investment strategy aligns with your investment objectives.
- Fund Manager's Track Record: Consider the track record and experience of the fund manager. A skilled and experienced fund manager can add value to the fund's performance through strategic decision-making.
Selecting Top-performing Funds:
Know Yourself: Your Investment Goals and Risk Appetite
Before you dive into the world of mutual funds, it's crucial to understand your own financial situation. Here are two key factors to consider:
• Investment Goals: What are you saving for? A fancy new phone (short-term) or retirement (long-term)? Different goals have different time horizons, which will influence your fund choices.
• Risk Appetite: How comfortable are you with your money going up and down? Higher potential returns often come with higher risk.
Here's a table to help you understand the relationship between risk appetite, time horizon, and suitable fund types:
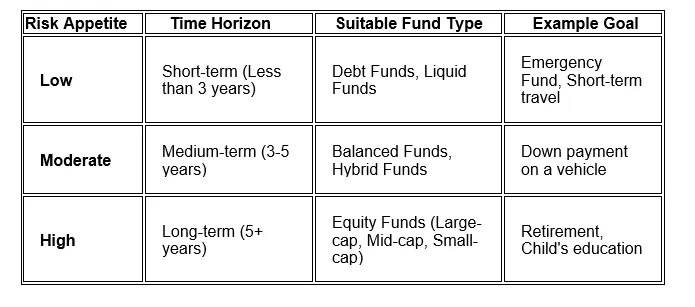
Remember: This is a general guideline. There are many different types of mutual funds within each category, so do your research!
Do Your Research: Picking the Winning Fund
Now that you know your risk profile and goals, it's time to find the perfect mutual fund. Here are some key things to look for:
- Performance: Check the fund's track record over different time periods (1 year, 3 years, 5 years) and compare it to similar funds and a benchmark index like the Nifty 50. Past performance isn't a guarantee of future results, but it gives you a sense of the fund manager's skills.
- Expense Ratio: As mentioned earlier, a lower expense ratio means more money stays invested in the fund and grows for you.
- Fund Manager's Experience: Research the fund manager's experience and track record. Are they known for making sound investment decisions?
Here's an example: Let's say you're 25 years old and have a high-risk appetite. Your goal is retirement, which is a long-term goal (20+ years). Based on this, you might consider an equity fund that invests in a mix of large-cap and mid-cap companies. You'd then compare different equity funds based on their performance, expense ratio, and the experience of the fund manager.
Once you've analyzed the performance of various mutual funds, shortlist the top-performing funds that align with your risk profile and investment goals. Here's a step-by-step guide to selecting the best mutual funds:
Step 1: Define Your Investment Goals: Determine your investment objectives, whether it's wealth creation, retirement planning, tax-saving, or income generation.
Step 2: Assess Your Risk Tolerance: Evaluate your risk tolerance based on your investment horizon and financial situation.
Step 3: Research Mutual Fund Categories: Understand the different types of mutual funds and their risk-return profiles.
Step 4: Analyze Fund Performance: Review the historical performance, risk-adjusted returns, expense ratio, and portfolio composition of shortlisted funds.
Step 5: Diversify Your Portfolio: Build a diversified portfolio by investing in a mix of equity, debt, and hybrid funds to spread risk.
Step 6: Monitor Your Investments: Regularly review your portfolio's performance and make adjustments if necessary to stay on track with your investment goals.
Conclusion:
Choosing the best mutual funds requires careful consideration of various factors, including your investment goals, risk tolerance, and fund performance. By following the tips outlined in this blog, you can make informed decisions and build a robust mutual fund portfolio that helps you achieve your financial aspirations. Remember, investing is a journey, and staying disciplined and patient is key to long-term success. Happy investing!


.webp)
.webp)

.webp)


START YOUR INVESTMENT JOURNEY
Get personalized advice from our experts
- Dedicated RM Support
- Smooth and Fast Trading App
