The Power of Compounding – Why Starting Early Matters


Introduction
Albert Einstein reportedly called compound interest the "eighth wonder of the world." Whether or not he actually said it, the math is undeniable. Compounding is the process where your investment returns begin earning their own returns — and over time, this snowball effect becomes truly extraordinary.
The catch? Compounding needs one essential ingredient: time.
The more years you give your money to grow, the more dramatic — and life-changing — the results become. This is exactly why starting your investment journey early, even with a modest amount, can make a difference of crores by the time you retire.
A Tale of Two Investors: Arjun vs Priya
Let's bring this concept to life with a simple, real-world example.
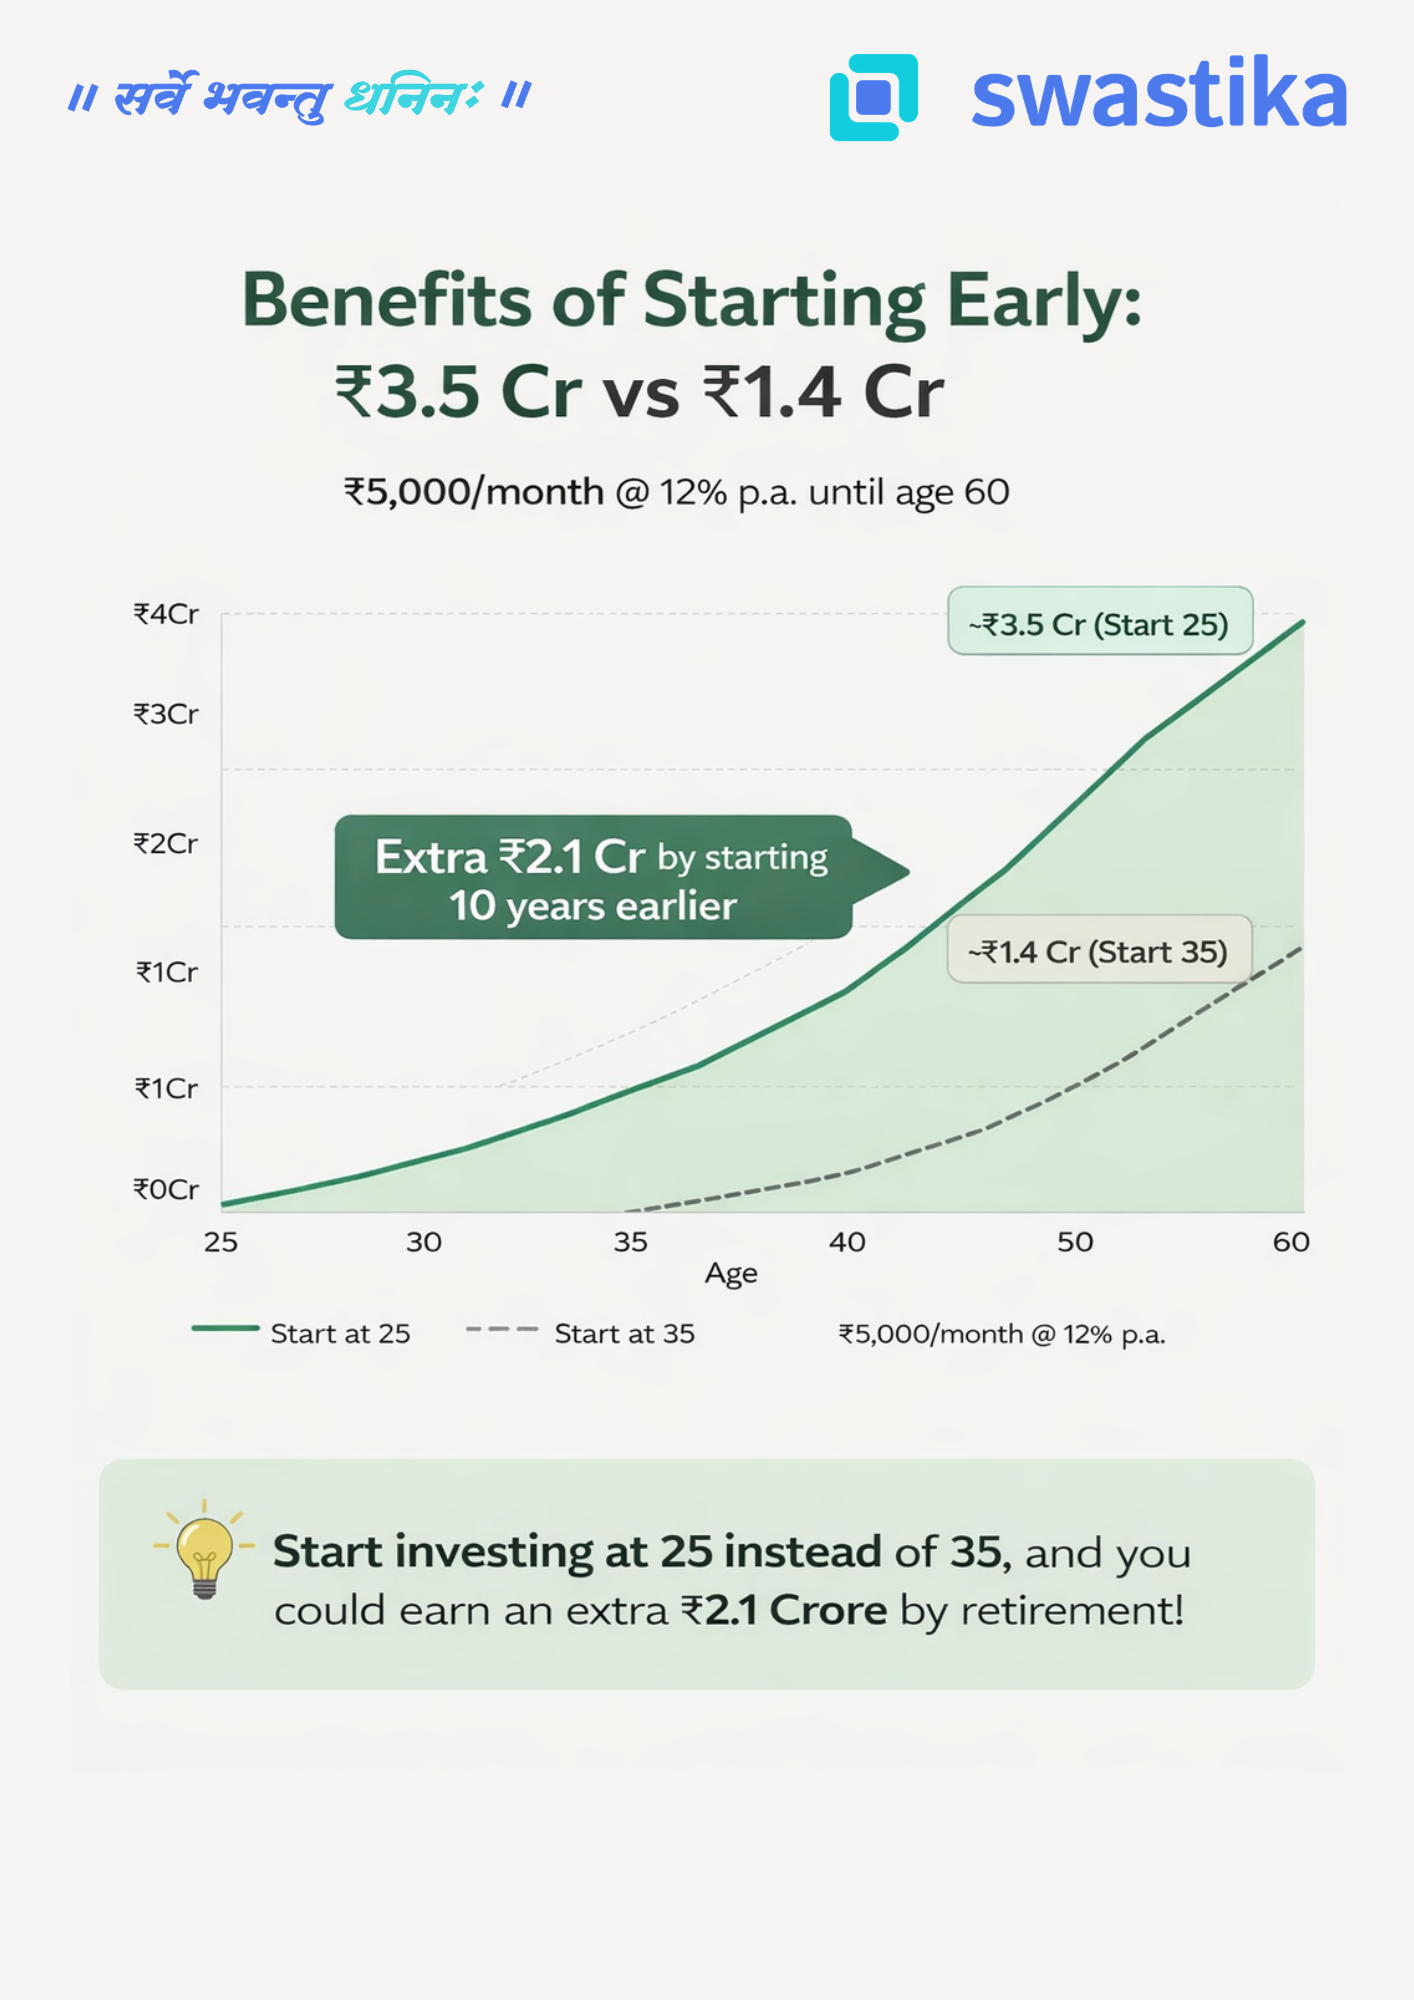
Meet Arjun and Priya. Both are sensible, disciplined investors. Both invest ₹5,000 every month through a SIP (Systematic Investment Plan) in equity mutual funds, earning an average annual return of 12%. Both stop investing at age 60.
The only difference? Arjun starts at 25. Priya starts at 35.

The numbers are striking. Arjun invests just ₹6 lakh more than Priya in absolute terms — yet walks away with ₹2.1 Crore more at retirement.
That extra ₹2.1 Crore didn't come from investing more aggressively or taking bigger risks. It came purely from starting 10 years earlier.
Why Does Time Make Such a Huge Difference?
This is where the magic of compounding reveals itself.
In the early years of investing, growth looks modest and almost unimpressive. But as the years pass, your corpus grows not just on your original investment, but on all the accumulated returns from previous years. The curve goes from almost flat to steeply exponential — and that steep climb happens in the later years.
When Arjun starts at 25, his money has 35 years to ride that exponential curve. Priya's money, starting at 35, only catches the last 25 years — and critically, it misses the steepest part of the climb in the final decade.
Think of it this way: the last 10 years of compounding are worth more than the first 20. That is the counterintuitive truth at the heart of long-term investing.
The Real Cost of Waiting
Many young earners tell themselves, "I'll start investing once I'm more settled — once the salary improves, once the EMI is paid off, once life is a bit easier."
But the numbers show that every year of delay is extraordinarily expensive — far more expensive than any EMI or lifestyle expense. Priya didn't invest carelessly. She invested faithfully for 25 years. Yet she ends up with less than half of what Arjun accumulated — not because she did anything wrong, but simply because she started a decade late.
The cost of waiting 10 years wasn't ₹6 lakh in additional contributions. The cost was ₹2.1 Crore in lost wealth.
Three Principles to Remember
1. Start now, not later.The best time to start investing was yesterday. The second best time is today. Even a SIP of ₹1,000–₹2,000 per month in your 20s is infinitely better than waiting for the "right time."
2. Consistency beats intensity.You don't need to invest large sums all at once. A small, steady, monthly commitment — maintained without interruption — is what unlocks the full power of compounding over decades.
3. Stay invested through market cycles.Compounding works only if you let it work. Exiting during market corrections or stopping your SIP in tough months breaks the chain. Time in the market, not timing the market, is what builds wealth.
The Bottom Line
If you are in your 20s or early 30s, you hold an asset that no amount of money can buy later: time. Use it. Start a SIP today — even a small one. Let compounding do its slow, steady, powerful work.
Because the difference between starting at 25 and starting at 35 is not just 10 years. As Arjun and Priya's story shows, that difference is ₹2.1 Crore.
Big Budget


.webp)
.webp)
.webp)
.webp)
.webp)


.webp)
.webp)
.webp)
.webp)
Latest Articles

India's First Bullion Exchange Launched


Launch of International Bullion Exchange in India at GIFT City
The prime minister launched the primary international bullion exchange in India at the nearby Gujarat International Finance Tec-City (GIFT City).
According to this arrangement, the NSE-IFSC order matching and trading platform are going to be used for all orders on Nifty derivatives placed by members of Singapore Exchange Limited (SGX).
In addition to accelerating the financialization of gold in India, this exchange would offer effective price discovery with the assurance of ethical sourcing and quality.
Why was it formed?
Foreign investors who don't want to register and trade in India sometimes buy Nifty contracts on the Singapore Exchange. At its peak, trading on the Nifty made up the maximum amount as 10% of the revenues at the Singapore Stock Exchange. Amid worries that foreign traders may migrate their trading activities to Singapore, India's stock exchanges agreed in early 2018 to cease granting licenses for her indexes to foreign bourses starting in August 2019.
SGX pulled NSE into a legal battle once the contract was terminated. The dispute was ultimately arbitrated. After deciding to sign a connection agreement at Gift City, the exchanges opted to finish the arbitration in September 2020.
India is the second-largest consumer of gold worldwide. the most important importer of precious metals, it brought in 1,069 tonnes of gold in 2021, a rise of 430 tonnes from the year before. the state has strict regulations for gold.
Only organizations and banks that the Federal Reserve Bank of India (RBI) has approved are now allowed to import gold.
Bullion
The term "bullion" refers to high purity physical sorts of gold and silver that are frequently kept as bars, ingots, or coins. Bullion is usually held by central banks as reserves or owned by institutional investors, and it's even regarded as legal money. The Bullion Spot Delivery Contract and Bullion Depository Receipt (BDR) with underlying Bullion as a Financial Product and related services as Financial Services were announced by the govt in August 2020.
Bullion Exchange
Through authorized banks and organizations, the import of gold was liberalized within the 1990s. then, accredited jewelers in India were for the primary time permitted to import gold directly through IIBX. This conversation is critical in and of itself. Jewelers must be longtime trading member's clients or trade partners in order to qualify for this.
IIBX are going to be led by Ashok Gautama as MD and CEO. before taking over in February 2022, he was employed with IDBI Bank. He formerly had an edge in the State Bank of India (SBI).
Features of IIBX
This exchange will standardize the financialization of bullion in India, bring transparency to the price-setting mechanism, and work as a standard-setting tool for the bullion's quality (IFSCA).
This would make it possible for authorized jewelers to import gold directly through IIBX, which is governed by the International Financial Services Centres Authority (IFSCA).
NRIs and institutions also will be eligible to participate in the exchange after registering with the International Financial Services Centre Association.
Gold 1 kg with a purity of 995 and gold 100 g with a purity of 999 is going to be traded in the early stages with a settlement period of T+0. The exchange is additionally anticipated to increase the settlement duration to T+2 days.
The establishment of IIBX is anticipated to empower India to require its proper place in the global bullion market and provide services to the global value chain. This affirms the govt of India's commitment to giving India the ability to influence global bullion prices as a major consumer.

डॉलर बना सेफ हैवन, कीमती धातुओं में दबाव
कीमती धातुओं के भाव में आक्रामक मौद्रिक नीति के चलते लगातार बिकवाली का दबाव बना हुआ है। पिछले सप्ताह सोने के भाव 50000 प्रति दस ग्राम के भीतर कारोबार करते नज़र आये जबकि प्रति किलो चांदी के भाव 52000 रुपये के निचले स्तरों को छू चुके है। अमेरिकी डॉलर, जो सोने के विपरीत दिशा में चलता है, में फेड प्रमुख जेरोम पॉवेल के बयान के बाद से ही तेज़ी जारी है और यह 110 के स्तरों के करीब पहुंच गया है जिससे सोने के भाव में दबाव बना हुआ है। अमेरिका से जारी होने वाली रोज़गार रिपोर्ट के आंकड़े लगातार बेहतर रहे है जिससे आर्थिक मंदी का डर कम हुआ है और इससे फेड को कठोर नीति कायम रखने में आसानी होगी। फेड श्रम से सम्बंधित आकड़ो पर कड़ी नजर रख रहा है ताकि यह पता लगाया जा सके कि नौकरी बाजार उच्च ब्याज दरों के प्रति कितनी सहनशीलता रखता है। पिछले सप्ताह जारी पैरोल के आकड़ो में नॉन फार्म एम्प्लॉयमेंट चेंज के आंकड़े अनुमान से बेहतर दर्ज किये गए जबकि बेरोज़गारी दर में बढ़ोतरी हुई है, लेकिन यह दर 4 प्रतिशत के नीचे रही जिसको फेड पूर्ण रोज़गार की स्थिति मानता है। अमेरिकी बेंचमार्क ट्रेज़री यील्ड चार साल के ऊपरी स्तरों पर पहुंच चुकी है जिससे डॉलर इंडेक्स को सपोर्ट मिला हुआ है और नॉन यील्डिंग सोने-चांदी की कीमतों में दबाव बन रहा है। ग्लोबल मैन्युफैक्चरिंग आकड़े कमजोर रहने के कारण चांदी के भाव में बिकवाली का दबाव है। इस सप्ताह गुरुवार को यूरोपियन सेंट्रल बैंक की मौद्रिक नीति कीमती धातुओं के लिए महत्वपूर्ण रहेंगी।
तकनीकी विश्लेषण:
इस सप्ताह कीमती धातुए में मंदी रहने की सम्भवना है। अक्टूबर वायदा सोने की कीमतों में 49000 रुपये पर सपोर्ट है और 51000 रुपये पर प्रतिरोध है। दिसंबर वायदा चांदी में 51000 रुपये पर सपोर्ट और 54500 रुपये पर प्रतिरोध है।

Earnings Season: What It Is And When It Happens
When Does Earnings Season Occur?
Earnings season kicks off a few weeks after each fiscal quarter ends. It spans about a month, during which companies report their financial performance. Here’s a breakdown of the schedule:
- April to June: Companies typically release their results in July or August.
- July to September: Results are usually published in October or November.
- October to December: Companies share their performance data in January or February.
- January to March: Results are announced in April or May.
What Is Earnings Season?
Earnings season is when companies publicly disclose their financial performance for the previous quarter. This period is crucial for investors because it provides insights into a company’s profitability, revenue, and overall financial health. These reports help investors make informed decisions about their investments.
How to Use Earnings Information
- Trade Stocks Based on Performancesome text
- Positive Earnings: If a company reports strong earnings, it’s likely that its stock price will rise. Investors might buy more shares, expecting the value to increase.
- Negative Earnings: Conversely, poor earnings can lead to a drop in stock price. Investors might sell their shares to avoid losses.
- Analyze Key Financial Metricssome text
- Gross Revenue: This is the total amount of money a company earns before subtracting any expenses. It provides a snapshot of the company's overall sales performance.
- Net Income: Also known as net profit, this is the amount left after all costs, taxes, and expenses are deducted from gross revenue. It indicates the company's profitability.
- EBITDA: Earnings Before Interest, Taxes, Depreciation, and Amortization. This metric shows how much profit a company makes from its core operations, excluding non-operational costs.
- Make Long-Term Investment Decisionssome text
- Buy More Shares: If you believe in a company’s long-term prospects, a negative earnings report might be a buying opportunity. Prices might drop short-term, but if the company has strong fundamentals, it might be worth investing more.
- Hold Your Position: If a company has a temporary setback but strong long-term potential, you might choose to hold your shares rather than selling them immediately.
- Avoid Knee-Jerk Reactionssome text
- Hold Your Stocks: Sometimes, it’s better to wait and see how things unfold. Many companies recover from poor earnings reports over time. Selling shares too quickly after a bad quarter could mean missing out on future gains.
- Invest in the Industrysome text
- Sector-Based Investments: If you notice that companies in a particular industry are performing well, consider investing in other companies within that sector. Strong performance in a sector can signal growth opportunities.
- Speculative Tradingsome text
- Play the Odds: Some investors try to predict whether a company's earnings report will be positive or negative before it’s released. They then make trades based on these predictions, hoping to profit from the stock price movement.
What Does Earnings Season Reveal About the Economy?
Earnings season provides insights into various aspects of the economy:
- Industry Health: Strong earnings reports from companies in specific sectors can indicate overall industry health and growth.
- Economic Trends: If major companies consistently meet or exceed expectations, it can be a sign of a robust economy. Conversely, widespread disappointing results might suggest economic troubles.
Important Considerations
- Look Beyond the Headlines: Earnings reports are just one aspect of a company’s performance. Consider other factors like market conditions, company strategy, and broader economic trends.
- Diversify Your Portfolio: Don’t base all your investment decisions on earnings reports. Diversify your investments to manage risk and protect against market volatility.
- Stay Informed: Keep up with earnings releases and financial news to make well-informed investment decisions.
Earnings season can give clues about how different parts of the economy are doing. Strong results from big companies can suggest a healthy economy, but it’s important to remember that the stock market and the economy don’t always move in the same direction.
Conclusion
Earnings season is a valuable period for investors to gain insights into company performance and market trends. By understanding key metrics, analyzing sector trends, and staying informed, you can make more strategic investment decisions. Use earnings reports to guide your investment strategy, whether that means trading stocks, investing in sectors, or making long-term decisions.
Remember, while earnings reports offer important information, they are just one part of a broader investment strategy. Always consider your overall investment goals and risk tolerance when making decisions based on earnings season insights

India becomes 5th Largest Economy in the World Surpassing UK
India Outpaced the UK to become the 5th largest economy
India was the eleventh-largest economy ten years ago, while the UK was the fifth-largest. Based on data on GDP provided by the International Monetary Fund. India surpass the UK in dollar terms annually this year, only behind the US, China, Japan, and Germany. In the final three months of 2021, India surpassed the UK to become the fifth-largest economy.
The IMF’s World Economic Outlook database shows India overtaking the U.K. in dollar terms on an annual basis this year with a GDP of $3.53 trillion compared to the U.K.’s $3.38 trillion.
UK’s Downfall
According to adjusted figures and the dollar exchange rate on the last day of the relevant quarter, the Indian economy was worth $854.7 billion in nominal cash terms in the three months ending in March. The United Kingdom was $816 billion on the same basis. a country with the highest inflation rate in four decades and growing recession risk, which the Bank of England predicts might persist well into 2024.
According to reports, the UK's ranking decline is the result of the nation's rising cost of living. For the first time since 1982, the nation saw double-digit consumer price inflation last month. With the pound losing 8% versus the rupee this year, sterling has underperformed the dollar relative to the Indian currency. In the second quarter, UK GDP increased by just 1% in real terms; after accounting for inflation, it decreased by 0.1%.
India Surpassed the UK
Indian equities have recently had a global-beating recovery, moving their weighting into second place in the MSCI Emerging Markets Index, only behind China's.
official figures revealed that India's gross domestic product (GDP) increased 13.5% in the June 2022 quarter (Q1FY23), as opposed to the 20.1% growth recorded in the first quarter of 2021–2022. According to an official statement, "Real GDP or gross domestic product (GDP) is anticipated to hit a level of Rs 36.85 lakh crore in Q1 2022-23, as against Rs 32.46 lakh crore in Q1 2021-22, indicating a rise of 13.5 percent as opposed to 20.1 percent in Q1 2021-22."According to National Statistical Office (NSO) figures, the country's gross value added (GVA), which is GDP less net product taxes and shows supply growth, increased by 12.7% between April and June 2022.
Reduced corporate taxes, the production-linked incentive (PLI) program, and India as a potential supply chain beneficiary all helped to stimulate and maintain domestic demand, particularly for investments.
Future Ahead
India's GDP grew by 13.5% in the first quarter of FY23. India's GDP is probably going to develop the quickest in the current fiscal year at this rate. Nirmala Sitharaman, the Union Finance Minister, has disclosed that India's Gross Domestic Product (GDP) growth will continue to grow at 7.4% in FY 2022–23 and in FY24 as well.
However, economists worry that the prospect of a global recession and rising interest rates might stifle growth in the ensuing quarters.
A variable monsoon is also expected to have an impact on rural demand and agricultural growth. Economists are also said to be concerned about the manufacturing sector's decreasing growth rate of 4.8% and the fact that imports are outpacing exports.
India is expected to benefit in the coming days as China's aspirations for fresh investments slow down.
Challenges to Overcome
Despite its great economic progress, the country nonetheless has its share of obstacles. According to the World Bank, access to development and new opportunities has been unequal and varies by area.
Furthermore, India is home to 25% of the world's poor. According to the UN, just 39% of its rural populations have access to sanitary facilities, and nearly half of the population still defecates in the open.
Although India overtook the UK there is a disparity in per capita income between the two countries caused by the size of India's population India has 1.3 billion inhabitants, which is three times the combined populations of the UK, France, Italy, and Brazil, vs the UK which has a population of 068 bn. Thus, our per capita GDP was $2,500 as opposed to $47,000. We still have much to go.

US China conflicts over Taiwan
Introduction
The semiconductor industry was put into the unexpected limelight in 2021 when chip shortages initially forced the shutdown of vehicle production lines. The focus grew when certain high-tech and consumer electronics businesses started to report chip shortages or expressed worries about supply chains.
Everyone can clearly see that we live in a world dominated by semiconductors, the small chips that power several automotive features, including blind-spot detection, seat adjustment, and interior Illumination.
Relations between Washington and Beijing are strained as a result of the rising tensions brought on by the visit of Nancy Pelosi, the speaker of the US House of Representatives.
What would occur if China annexed Taiwan?
Some scholars claim that if China conquers Taiwan, the former will gain more independence to expand its strength throughout the western Pacific.
Furthermore, China may put the American military outposts in jeopardy if this takeover occurs, especially those on the island regions.
China, however, disputes any bad intentions and insists that its goals are wholly benign. But President Xi Jinping of China declared that "reunification with Taiwan must be realized" and that if necessary, the force will be used to achieve this goal.
Simply put, the dragon views the island country as a renegade province that the latter seeks to subdue.
What is the US's role in the conflict between China and Taiwan?
Washington has a history of strategic ambiguity, to the point where it might use force to intervene if China invaded Taiwan. The One-China policy, which recognizes only one Chinese government, based in Beijing, and has formal links with Beijing rather than Taipei, is adhered to by this country in its official capacity. It has, however, also promised to give Taiwan protective armaments and emphasized that any invasion by China would be of great concern.
Taiwan is the largest supplier of Semiconductor Chips in the World
A significant portion of Taiwan's IT sector is made up of the semiconductor industry, which includes IC manufacture, design, and packing. Taiwan plays a significant role in the semiconductor industry's worldwide supply chain.
Additionally, its contract manufacturers represented more than 60% of the entire income generated by semiconductors worldwide in 2021.
Around 20% of the world's semiconductor market, or US$115 billion, was accounted for by Taiwan. Taiwanese businesses control 50% of the global market in some industries, such as foundry operations, with Taiwan Semiconductor Manufacturing Company (TSMC) dominating the foundry industry.
Taiwan manufactures essential semiconductors and electronic equipment and controls 10% of the world's shipping container capacity, holding a crucial role in the global supply chain.
Technology companies from Taiwan control the majority of the world's capacity for producing semiconductors, including cutting-edge and effective chips. The largest contract chip manufacturer in the world, Taiwan Semiconductor Manufacturing Co Ltd (TSMC), is now investing in a new $12 billion facility in Arizona.
India’s Role in the entire Scenario
India has its own limitations, therefore it won't participate more politically in Taiwan unless the situation is dire. Since the beginning, India has adhered to a "One China" policy; yet, India must recognize that Taiwan is the main center of the American Indo-Pacific strategy. In the bigger picture of limiting China, it does play a significant supporting role.
Our links now extend beyond commerce to include educational possibilities for Indians who wish to learn Chinese and follow Chinese trends.
Global Impact
The COVID-19 epidemic and China's zero-COVID policy have already caused unprecedented amounts of disruption in supply chains throughout the world since 2020.
Due to trade and supply route restrictions brought on by the Russia-Ukraine war, shipping prices have increased.
A blockage or delay in semiconductor chip exports might be one of the numerous effects of a confrontation between China and Taiwan. This would have an impact on several global businesses, including manufacturing, internet communications technology (ICT), and research and development.
The Taiwan Strait is one of the busiest shipping lanes in the world, helping the transport of technology and natural gas supplies to international markets.
A butterfly effect might result in hyperinflation, job losses when factories stop operating, and recessionary economies.

SBI Q1 Results: Net Profit Dropped by 6.7%
SBI Financials
State Bank of India's net profit in the first quarter of the current financial year on a standalone basis has declined by 7 percent.
State Bank of India (SBI) reported a net profit of Rs 6,068.08 crore compared with Rs 6,504 crore in the same quarter last year. Due to Mark to Market (MTM) losses on its investment book, the bank's operating profit decreased by 33% to Rs 12,753 crore from Rs 18,975 crore in the April-June quarter of the previous fiscal.
The bank's interest income increased to Rs 72,676 crore from Rs 65,564 crore previously. Net interest income grew from Rs 27,638 crore in the first quarter of the previous fiscal to Rs 31,196 crore which is 12.87 percent. The net interest margin increased from 3.15 to 3.23 percent.
Core operating profit jumped by 14.39 percent year over year, from Rs 16,873 crore in Q1 FY22 to Rs 19,302 crore in Q1 FY23, when trading income and MTM were excluded.
The bank's gross (NPA) ratio increased from 5.32 percent at June's end of the previous year to 3.91 percent today. Similar to this, net NPAs decreased from 1.7% in June 2021 to 1.02 in June 2022. Domestic NIM for Q1FY23 climbed by 8 bps YoY to 3.23 percent. While the net NPA ratio decreased by 77 bps YoY to 1.00 percent, the gross NPA ratio decreased by 141 bps YoY to 3.91 percent.
The Provision Coverage Ratio (PCR), which was 75.05 percent, increased by 719 bps YoY. A 90.14 percent PCR (Inclusive AUCA) was reported. The slippage ratio for the reviewed quarter was 1.38 percent, an improvement of 109 bps year over year. Corporate loan volume increased by 10.57%, while SME and agricultural loans also saw year-over-year increases of 10.01% and 9.82%, respectively.
Deposit increased by 8.73% to Rs. 40 lakh crore. As of June 30, the bank's CASA ratio dropped 64 basis points to 45.33 percent. Retail bank deposits are up 8.73% year over year. Credit Cost for Q1 FY23 was 0.61 percent, up 18 basis points year over year. At the end of the June quarter of 2022–23, the capital adequacy ratio (CAR) was 13.43%.
SBI added that 38% of retail asset accounts and 65% of savings bank accounts were opened online using YONO. The proportion of alternate channels in all transactions climbed from 95.1% in the first quarter of FY22 to 96.6 in the first quarter of FY23.
Reasons:
Due to Mark to Market (MTM) losses on its investment book, the bank's operating profit decreased by 33% to Rs 12,753 crore from Rs 18,975 crore in the April-June quarter of the previous fiscal.
The bank's Return on Asset and Return on Equity, which was 0.48 percent and 10.09 percent, respectively, suffered from the MTM hit.
Non-interest income fell significantly. The sharp reduction in SBI's non-interest income was a significant factor in the company's profit decline. In the June quarter, SBI's non-interest income was barely Rs 2,312 crore, compared to Rs 11,802 crore in the same quarter of the prior fiscal year.
How much return did SBI share give?
Talking about the stock of SBI, the company's stock has given a return of 13 percent to the investors in YTD time. At the same time, it has given a return of 22.20 percent in the last year and has given a return of 90.02 percent to the investors in the last 5 years.
Performance of SBI Share Price
Promoter ownership of SBI was 57.57 percent as of June 2022, with no shares pledged.
Dividends of Rs 07.10 per share have been issued by SBI for the fiscal year that ended in March 2022.
SBI's share price increased by 84.45, or around 19.38 percent, during the course of the past year, from Rs 435.7 to Rs 520.1.
At 43,884.2, the S&P BSE BANKEX Index is now trading (up 0.77 percent). It increased by 3,153.0 points (up 7.74 percent) in the past year, from Rs 40,731.3 to Rs 43,884.2.
The S&P BSE SENSEX has increased 8.25% overall.


.webp)
.webp)

.webp)


START YOUR INVESTMENT JOURNEY
Get personalized advice from our experts
- Dedicated RM Support
- Smooth and Fast Trading App
