The Power of Compounding – Why Starting Early Matters


Introduction
Albert Einstein reportedly called compound interest the "eighth wonder of the world." Whether or not he actually said it, the math is undeniable. Compounding is the process where your investment returns begin earning their own returns — and over time, this snowball effect becomes truly extraordinary.
The catch? Compounding needs one essential ingredient: time.
The more years you give your money to grow, the more dramatic — and life-changing — the results become. This is exactly why starting your investment journey early, even with a modest amount, can make a difference of crores by the time you retire.
A Tale of Two Investors: Arjun vs Priya
Let's bring this concept to life with a simple, real-world example.
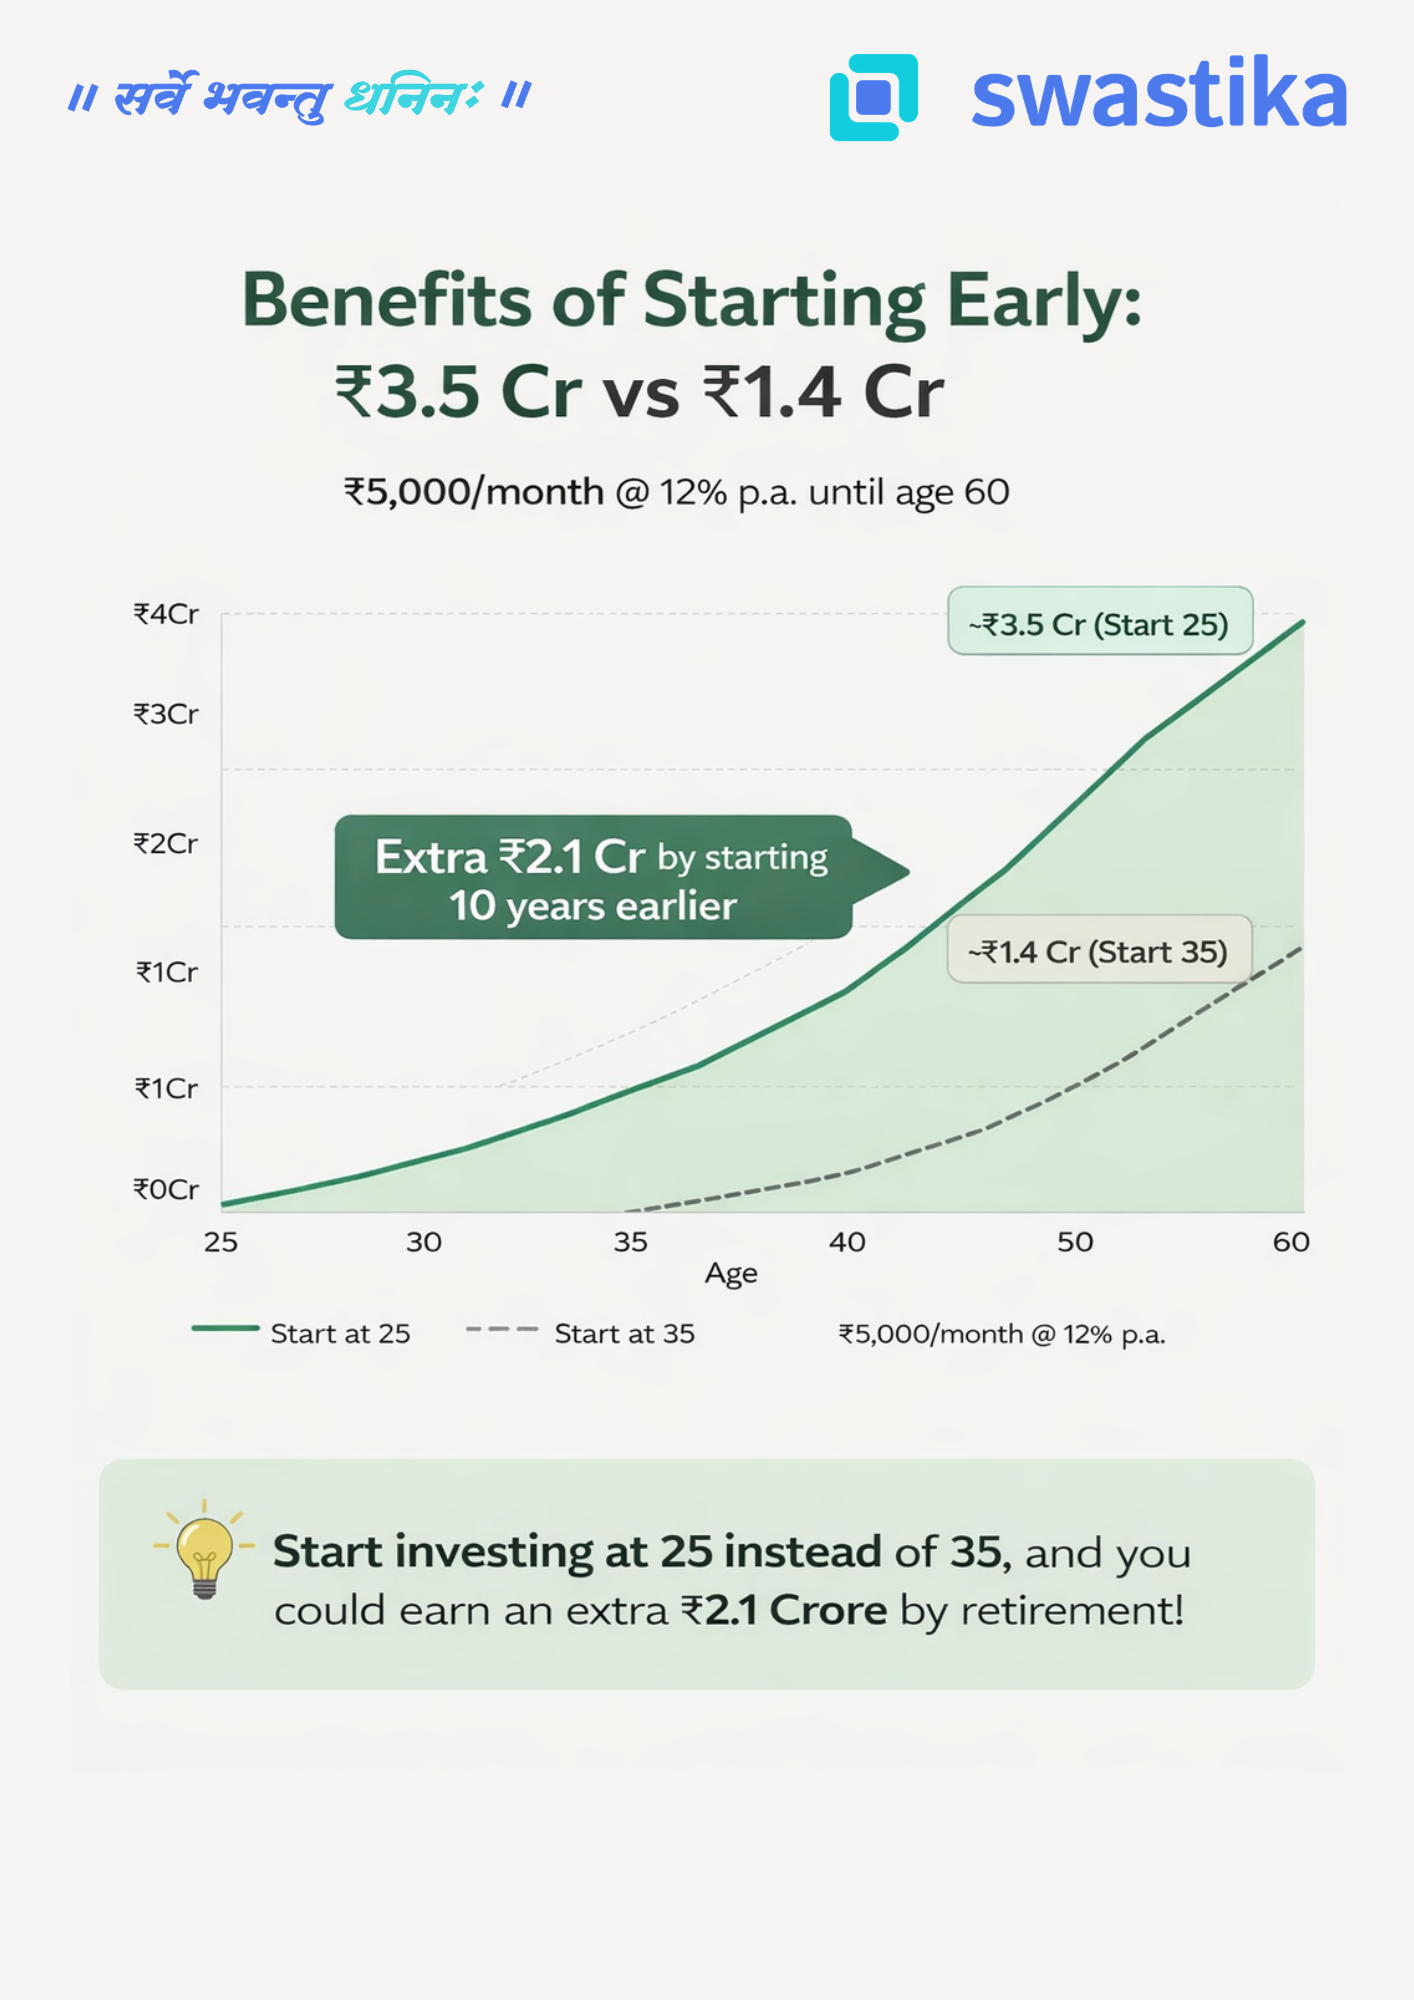
Meet Arjun and Priya. Both are sensible, disciplined investors. Both invest ₹5,000 every month through a SIP (Systematic Investment Plan) in equity mutual funds, earning an average annual return of 12%. Both stop investing at age 60.
The only difference? Arjun starts at 25. Priya starts at 35.

The numbers are striking. Arjun invests just ₹6 lakh more than Priya in absolute terms — yet walks away with ₹2.1 Crore more at retirement.
That extra ₹2.1 Crore didn't come from investing more aggressively or taking bigger risks. It came purely from starting 10 years earlier.
Why Does Time Make Such a Huge Difference?
This is where the magic of compounding reveals itself.
In the early years of investing, growth looks modest and almost unimpressive. But as the years pass, your corpus grows not just on your original investment, but on all the accumulated returns from previous years. The curve goes from almost flat to steeply exponential — and that steep climb happens in the later years.
When Arjun starts at 25, his money has 35 years to ride that exponential curve. Priya's money, starting at 35, only catches the last 25 years — and critically, it misses the steepest part of the climb in the final decade.
Think of it this way: the last 10 years of compounding are worth more than the first 20. That is the counterintuitive truth at the heart of long-term investing.
The Real Cost of Waiting
Many young earners tell themselves, "I'll start investing once I'm more settled — once the salary improves, once the EMI is paid off, once life is a bit easier."
But the numbers show that every year of delay is extraordinarily expensive — far more expensive than any EMI or lifestyle expense. Priya didn't invest carelessly. She invested faithfully for 25 years. Yet she ends up with less than half of what Arjun accumulated — not because she did anything wrong, but simply because she started a decade late.
The cost of waiting 10 years wasn't ₹6 lakh in additional contributions. The cost was ₹2.1 Crore in lost wealth.
Three Principles to Remember
1. Start now, not later.The best time to start investing was yesterday. The second best time is today. Even a SIP of ₹1,000–₹2,000 per month in your 20s is infinitely better than waiting for the "right time."
2. Consistency beats intensity.You don't need to invest large sums all at once. A small, steady, monthly commitment — maintained without interruption — is what unlocks the full power of compounding over decades.
3. Stay invested through market cycles.Compounding works only if you let it work. Exiting during market corrections or stopping your SIP in tough months breaks the chain. Time in the market, not timing the market, is what builds wealth.
The Bottom Line
If you are in your 20s or early 30s, you hold an asset that no amount of money can buy later: time. Use it. Start a SIP today — even a small one. Let compounding do its slow, steady, powerful work.
Because the difference between starting at 25 and starting at 35 is not just 10 years. As Arjun and Priya's story shows, that difference is ₹2.1 Crore.
Big Budget


.webp)
.webp)
.webp)
.webp)
.webp)


.webp)
.webp)
.webp)
.webp)
Latest Articles
Weekly Market Outlook June 22


Weekly Market Outlook
20 June-24 June 22
Bulls look for relief rally amid cool-off in energy prices
It was a brutal sell-off at Dalal street last week where headline indices Nifty and Sensex lost more than 5% with a break of key support levels. Weak global cues, a sharp rate hike in the USA, and aggressive selling by FIIs were key reasons for last week's turmoil.
The market has no major cues this week but bulls will look for a relief rally after a sharp fall in energy prices over the weekend. The brent crude oil prices have dipped to the $113 level after hitting a high of $125 per barrel. However, relentless selling by FIIs is a key concern for the Indian markets, where last week they sold more than 23000cr in the cash market. On the global front, the market has an eye on the Russia-Ukraine situation as there is some hope for any peace agreement. On the domestic front, the rupee movement and the development of the monsoon will be other important factors for the market.
Technically, Nifty has surrendered key support of the 15700 level and there is a risk of further downside, where 15000 is a key psychological support level then 14500 is the next major support therefore 15000-14500 is a key demand zone where we can expect a bottom formation. However, On Friday's trading session, Nifty formed a Doji candlestick formation followed by a sharp sell-off therefore low of the Doji candle, which is placed at the 15183 level, will act as an immediate support level. On the upside, 15500/15700 are immediate and critical resistance levels.
Banknifty has slipped below the psychological level of 33000 however 32250-32000 is an immediate and critical demand zone where we can expect a bounce back; below this, 30500 will be the next support level. On the upside, if 33000 is an immediate hurdle then 33750-34000 is the next supply zone.
If we look at the derivative data, then the long exposure of FIIs in the index future is a multi-year low of 13% whereas the put-call ratio is sitting at 0.75 level, therefore, the overall market looks oversold.
Weekly Market Outlook
13 June-18 June 22
Inflation is spooking market sentiments ahead of the FOMC meeting
Key Triggers:-
Bulls had a dreadful weekend after the US inflation figures hits a 40-year high, leaving US markets in a tizzy on Friday. The US FOMC's decision is due on 15th June and the market is fearing aggressive rate hikes amid the inflation monster. Bank of Japan will also announce its credit policy next week on 17th June. It will be salient to watch the behavior of FIIs' amid the panic in global equity markets as they have been selling relentlessly for the past 8 months.
On the domestic front, our CPI inflation will be announced on 13th June and WPI will be announced on 14th June.
Apart from this, movement of rupee and crude oil will be other important factors.
Technical Outlook:-
Nifty has slipped below its 20-DMA, raising concerns for a fresh round of selling where 16050 is the immediate support level while 15900-15700 is the critical support area. On the upside, 20-DMA of 16300 will act as an immediate hurdle while 16500 is the next major hurdle.
Bank nifty has also slipped below its 20-DMA which could lead to further selling pressure where 33800 is the immediate support level while 33000-32500 will be the critical support zone. On the upside, 20-DMA of 34800 will act as an immediate hurdle.
Derivative Data:-
If we talk about derivative data, FII's long exposure to index futures has come down to 21% which is extremely oversold zone while PCR is also trading at oversold level of 0.88. An oversold market is only a hope for the bulls, although the market may remain oversold for a long time.

ग्लोबल सेंट्रल बैंको की आक्रामक नीति से कीमती धातुओं में बढ़ी अस्थिरता।
पिछले सप्ताह के शुरुवात में सोने और चांदी के भाव में दबाव रहा लेकिन अमेरिकी फ़ेडरल रिज़र्व द्वारा ब्याज दरों में अनुमान से अधिक वृद्धि करने से कीमतों में निचले स्तरों से सुधार दर्ज किया गया। यूएस फेडरल रिजर्व (फेड) ने बुधवार को 1994 के बाद से अपनी उच्चतम ब्याज दरों में बढ़ोतरी की है।
ब्याज दरों को 1 प्रतिशत से बढ़ाकर 1.75 प्रतिशत कर दिया है जबकि अनुमान 1.5 प्रतिशत तक वृद्धि का था। अमेरिका में मुद्रास्फीति 41 साल की उचाई पर पहुंच गई है जिसके कारण फेड की चिंता बढ़ गई है। इस महगाई को नियंत्रित करने के लिए फेड द्वारा ब्याज दरों में आक्रामक वृद्धि और बैलेंस शीट कटौती का रुख अपनाया गया है।
आक्रामक मौद्रिक नीति का असर अमेरिका से जारी होने वाले आर्थिक आकड़ो में दिखाई देने लगा है और आर्थिक मंदी की सम्भावना बढ़ने लगी है जिससे सोने और चांदी की कीमतों को निचले स्तरों पर सपोर्ट है।
स्विस नेशनल बैंक ने भी गुरुवार को अप्रत्याशित रूप से दरों में 50 आधार अंकों की बढ़ोतरी की, जबकि बैंक ऑफ इंग्लैंड ने अपनी ब्याज दरों को बढ़ाकर 1.25 प्रतिशत कर दिया। बैंक ऑफ जापान ने शुक्रवार को बढ़ती मुद्रास्फीति के बावजूद नीति को सरल रखने का फैसला किया, जबकि वैश्विक केंद्रीय बैंक सख्त मौद्रिक नीतियां अपना रहे हैं।
घरेलु वायदा बाज़ार में सोना 1 प्रतिशत और चांदी में 0.40 प्रतिशत की गिरावट रही। यूएस डॉलर इंडेक्स और यूएस बेंचमार्क ट्रेज़री यील्ड में भी ऊपरी स्तरों पर दबाव रहा। हालांकि, सोने की कीमते निचले स्तरों से सुधर कर 51100 रुपये प्रति दस ग्राम और चांदी के भाव 61700 रुपये प्रति किलो पर कारोबार करते दिखे।
तकनीकी विश्लेषण:
सोने और चांदी के भाव में इस सप्ताह दबाव में रह सकते है। सोने में 50000 रुपये पर सपोर्ट है और 52000 पर प्रतिरोध है। चांदी में 58000 रुपये पर सपोर्ट और 63000 रुपये पर प्रतिरोध है।

Paper Gold vs Physical Gold
Paper Gold a Safe Investment
Gold is a commodity and it can be traded as a commodity. As with any commodity, it's possible to trade futures contracts on gold. These are called paper gold because they only represent the value of the physical gold that is delivered at maturity.
The seller of such a contract is obliged to deliver the physical metal when the contract matures, while the buyer has to pay for it in advance.
If you buy a futures contract on gold today and hold onto it until maturity, you'll get the physical metal when you need it. If you don't have any use for physical gold but still want to benefit from its price movements, paper gold can be an alternative for you.
To get more information about paper gold feel free to call us at 0120 4400700
Paper Gold vs Physical Gold
If you want to buy gold then it is very important that you understand the difference between physical gold and paper gold.
Physical gold is the actual metal that is bought from dealers. This will be stored in a vault by the dealer and can also be kept at home.
It is advisable to keep gold at home rather than leaving it with the dealer as there have been instances where dealers have been robbed by thieves or even customers who have turned out to be fraudsters.
Paper gold on the other hand is paper certificates that represent physical gold. They are like money in terms of their use but are not actually real money but instead represent an amount of physical gold held by an issuer.
There are many types of paper certificates such as exchange traded funds (ETFs), futures contracts and options contracts but each one works slightly differently from another type of certificate so it is important that you understand how they work before you invest your money in them.
Is it Safe to Invest in Paper Gold
The answer to the above question is a big YES.
Paper gold has been around for a long time and is widely accepted by investors as a safe way of investing in gold. There are several reasons why paper gold is considered one of the most secure ways to invest in gold. The following are some of these reasons:
1) Paper gold does not require any cash upfront. This makes it possible for anyone interested in investing in gold to do so easily, irrespective of their financial status or income level.
2) Paper gold can be traded as easily as stocks or bonds on stock exchanges like NSE, MCX etc, and this makes it easy for investors to buy and sell their investments whenever they want.
3) Investors can use paper gold as collateral against loans from banks or other financial institutions if they need money urgently or need some extra cash flow for their business operations. This gives them more control over their finances and helps them avoid losing all their investment if things go wrong.
Final Note
Most investors choose one or another type of gold investment based on their preferences. Some people prefer the ease and convenience of holding paper assets instead of actual bars and coins. Others want the security that comes with having physical assets under their control. If you want safety and convenience, then paper assets are probably better suited to your needs than physical ones.

Tips to Avoid Losses in Intraday Trading
Intraday trading can be thrilling, offering the chance to make quick profits. However, it also comes with its share of risks, especially for those new to it. Losing money can happen easily if you’re not careful.
To help you stay on track and avoid common mistakes, we’ve put together some practical tips. These will guide you in making smarter decisions, managing your risks, and keeping your emotions in check while trading.
Whether you’re dealing with well-known stocks like Reliance Industries or exploring smaller companies in the Indian market, these tips will help you trade more confidently and protect your investments. Let’s dive into these straightforward strategies to make your trading experience smoother and more successful..
1. Develop a Trading Plan
Set Clear Objectives
Before you start trading, set specific goals for each trade. For example, you might aim for a profit of 2% per trade and decide that you are willing to accept a loss of up to 1% if things don’t go as planned.
- Daily Target: Suppose you’re trading stocks like Reliance Industries (RIL). You might set a goal to achieve a daily profit of ₹5,000.
- Weekly Target: You might aim to earn ₹25,000 by trading stocks like Infosys or Tata Motors throughout the week.
Create a Strategy
Your trading strategy should be based on technical analysis. For instance, you could use moving averages to determine entry and exit points.
2. Risk Management
Implement Stop-Loss Orders
A stop-loss order helps limit your losses by automatically selling a stock when it reaches a certain price.
- If you buy Tata Consultancy Services (TCS) at ₹3,500, setting a stop-loss at ₹3,450 means your stock will automatically sell if the price drops to ₹3,450, capping your loss.
Use Proper Position Sizing
Determine how much of your total capital to risk on each trade, typically between 1-2%.
- If your total trading capital is ₹1,00,000, risking 2% per trade means you should risk ₹2,000 on each trade. So, if you’re trading Maruti Suzuki and the potential loss on a trade is ₹2,000, you adjust your position size accordingly.
3. Market Research
Stay Updated with News
Financial news and economic reports can impact stock prices.
- If there’s news about government regulations affecting the auto sector, this could influence the stock price of companies like Mahindra & Mahindra.
Analyze Technical Indicators
Use technical indicators to gauge stock trends.
- The Relative Strength Index (RSI) can help you identify whether a stock like ICICI Bank is overbought or oversold. An RSI above 70 may indicate overbought conditions, while an RSI below 30 might signal oversold conditions.
4. Avoid Emotional Trading
Stick to Your Plan
Make decisions based on your trading plan rather than emotional reactions.
- If you’re holding shares of State Bank of India (SBI) and the stock dips, avoid the temptation to hold onto it in hopes of recovery unless it aligns with your strategy.
Maintain Discipline
Consistency is key. Follow your trading strategy and avoid deviating from it based on market fluctuations.
5. Control Your Leverage
Use Leverage Cautiously
Leverage amplifies both gains and losses. Use it within your risk tolerance.
- If you use 2x leverage while trading stocks like Bajaj Finance, a 5% move in the stock price will result in a 10% change in your position. Be cautious of such magnified risks.
Understand Margin Requirements
Be aware of the margin requirements and how they impact your trades.
- If the margin requirement for trading in Adani Enterprises is 20%, ensure you have sufficient funds to cover this margin.
6. Review and Adjust
Maintain a Trading Journal
Record every trade detail, including entry and exit points and reasons for taking the trade.
- Note down why you bought shares of HDFC Limited and track how the trade performed. Regularly review these notes to understand what strategies work best.
Adjust Your Strategy
Based on your trading journal, make necessary adjustments to improve your strategy.
- If you find that trading during market volatility with broader stop-loss levels yields better results, adjust your strategy to incorporate this insight.
7. Focus on Liquid Stocks
Trade High Liquidity Stocks
Choose stocks with high trading volumes to avoid significant price slippage.
- Stocks like Infosys and Reliance Industries are highly liquid, allowing you to enter and exit trades smoothly.
8. Be Prepared for Market Conditions
Adapt to Market Volatility
Adjust your approach based on market conditions.
- In a volatile market, such as during major economic announcements, you might use tighter stop-loss orders to protect your capital.
Avoid Overtrading
Focus on quality trades that meet your criteria rather than trading excessively.
- If your strategy suggests that trading IT stocks during earnings season is more profitable, stick to this approach rather than trading random stocks frequently.
Conclusion
Intraday trading can be exciting, but it’s important to be careful to avoid losing money. By following the simple tips we’ve discussed, like setting clear goals, using stop-loss orders, and staying updated with market news, you can reduce your risk and make better decisions.
Remember, it’s not just about chasing quick profits. It’s also about protecting your money and staying calm under pressure. Using these strategies and staying disciplined will help you trade more successfully and avoid common mistakes.
Keep these tips in mind, and you’ll be on your way to becoming a more confident and successful intraday trader.

Top Green Energy Stocks in 2022
We all know that the price of crude oil has increased by 61.13% in the last year. It simply means that the non-renewable resources are limited on the planet and we need to find a suitable alternative for our needs.
Here green energy comes into play. Due to high demand, the price of petroleum, crude oil, and CNG has been on a continued rise which makes the people difficult to sustain. To tackle such issues, many companies have started generating green energy from natural resources such as wind, sunlight, air, water etc.
The companies which generate green energy, the stocks of these companies are known as green energy stocks.
What are Green Energy Stocks?
The companies which generate green energy from natural resources such as sunlight, water, and air are called green energy companies and hence the stocks of these companies are known as green energy stocks.
The companies produce green energy with an objective to minimize pollution and save the environment from the destruction such as mining which may damage the whole ecosystem.
Nowadays many investors are willing to put their money in green energy stocks as they give outstanding stock market trading returns to them.
Are Green energy Stocks Worth Investing?
Green energy is the need of the future, hence its requirement will never end. Below are the reasons why you need to invest in green energy stocks:
Unpredictable Fossil Fuel Prices
The uncertain price of fossil fuels gives rise to green energy. We can understand it by taking the example of crude oil prices. During the pandemic, the demand for crude oil completely stopped, and as a result, the price for the same got also declined.
Recently, we experienced a huge demand for crude oil which in turn increased the price as well.
Government’s Actionable Step to Save the Environment
Seeking the importance of green energy, several governments have started in investing green energy in order to save the environment from hazards. As the production of green energy increases, the growth also increases, which in turn increases the stock prices.
Evergreen Stocks
Climate change and pollution are the major reasons behind global warming. To solve this problem, green energy came into existence which is produced by air, sunlight, wind and water.
To combat such things, the companies with the help of the government have already started taking actionable steps by replacing fossil fuel vehicles with electronic vehicles as thy reduce the carbon emission to a greater extent.
Here are the Top Green Energy Stocks to Invest in 2022:
Adani Green Energy Ltd
Adani Green Energy is considered one of the largest renewable energy companies in India. According to the sources, the company has power projects in 11 states in pan India. Also, the company has a capacity to generate a power of 13,990 MW.
The stock had given an outstanding return of 57.8% from 30 July to 29 December 2021.
JSW Energy
JSW Energy Limited is a part of the Jindal group. The company is primarily known for generating green energy as it has a total of 6 electricity projects across India with a capacity of 4,559 MW. Also, the company is planning to set up 3 projects in the near future.
Tata Power
Tata power has the motive of generating green energy from renewable energy sources. Currently, the company has a total capacity of generating 12,800 MW through several hydro and thermal projects.
If we talk about the stock prices, Tata power gave satisfying returns as the share prices increased from Rs 74.15 to Rs 218.60 in a short period.
GAIL
Gas Authority of India Ltd is the largest natural gas processing and distribution corporation in India. Incorporated in 1984, GAIL currently owns over 11,500 kilometres of natural gas pipelines and over 23,00 kilometres of liquefied petroleum gas pipelines in India.
The majority of the revenue of GAIL comes from the distribution of natural gas.
Revenue breakup of GAIL
- Natural Gas trading and marketing - 76.5%
- Petrochemicals - 7.5%
- Natural gas transmission - 7.5%
- LPG and another hydrocarbon - 5%
- LPG Transmission - 1%
- City Gas - 0.83%
- Other sources - 1.4%
Borosil Renewables
Borosil Renewables is a solar glass manufacturer that manufactures several products such as scientific ware, and consumer ware products. It generates 77% of its revenue from India itself and the remaining by doing exports to USA, Europe and Turkey.
Tips to Invest in the Top Green Energy Stocks
Although there are several green energy stocks available on stock exchanges, finding a good green energy stock would be a challenging role and needs a lot of stock market research and time.
Types of Charts in Intraday Trading
Intraday trading is the process of trading financial instruments within a single day. The transactions generally occur within a few minutes to an hour before the market closes for the day. Intraday traders are usually those who wish to make money from short-term price fluctuations in the market. So Today in this blog we will discuss the types of charts in Intraday trading.
Charts are useful because they allow you to see how far prices have moved in relation to each other over time. They show you how far each bar on the chart goes up or down and how many times this has happened before, which is important information for traders who want to know whether a particular price move is unusual or normal for that particular security.
This allows you to analyze whether there were any significant changes in price during each bar, as well as how far they moved from their open or close prices at the end of each bar.
Charts in Intraday Trading
Tick-Trade Chart in Intraday Trading
Tick charts are the most popular type of chart for intraday trading. They show price movements as little ticks on a grid and can be used to track the price action of individual stocks and commodities.
These charts are called tick charts because they show the bid/ask prices for each trade, with each trade being one tick on the chart. The next trade is plotted two ticks away from the last one, and so on.
Hourly Charts in Intraday Trading
Hourly charts are great for day traders who want to see which way the market is trending over a long period of time.
If you're looking at an hourly chart, all the information will be displayed in one grid that shows the hourly price action all in one place.
This makes it easy to see if there's any major upward or downward movements occurring over a long period of time.
Intraday Five-Minute Charts
The five-minute time frame is one of the most popular time frames for intraday traders. It allows them to watch market movements in real time and react quickly to price changes.
The five-minute chart is also ideal for day traders because it allows them to take advantage of short-term price movements.
15-Minute Charts
15-minute charts are best used by swing traders who want to see how their stocks have performed during different periods throughout the day before making a decision on whether or not to buy or sell their positions.
These charts typically only display five candles per candle line, so they're not as detailed as other types of charts, but they can still be helpful when looking at historical price action over time.
A tick chart is appropriate for traders who want to see all of the activity in a single market or security over time, including both large and small moves.
Final Note
Charts analysis is one of the most important aspects of intraday trading. Although it is not required to know charting techniques to take up intraday trading, it helps in making better decisions. The chart gives a lot of information about the market which cannot be obtained from just looking at the quotes on the screen.
Charts show trends and patterns which are very useful for intraday traders as they help them make better decisions. If you want to make your trade successful in intraday, these charts will definitely help you give outstanding returns.


.webp)
.webp)

.webp)


START YOUR INVESTMENT JOURNEY
Get personalized advice from our experts
- Dedicated RM Support
- Smooth and Fast Trading App
