The Power of Compounding – Why Starting Early Matters


Introduction
Albert Einstein reportedly called compound interest the "eighth wonder of the world." Whether or not he actually said it, the math is undeniable. Compounding is the process where your investment returns begin earning their own returns — and over time, this snowball effect becomes truly extraordinary.
The catch? Compounding needs one essential ingredient: time.
The more years you give your money to grow, the more dramatic — and life-changing — the results become. This is exactly why starting your investment journey early, even with a modest amount, can make a difference of crores by the time you retire.
A Tale of Two Investors: Arjun vs Priya
Let's bring this concept to life with a simple, real-world example.
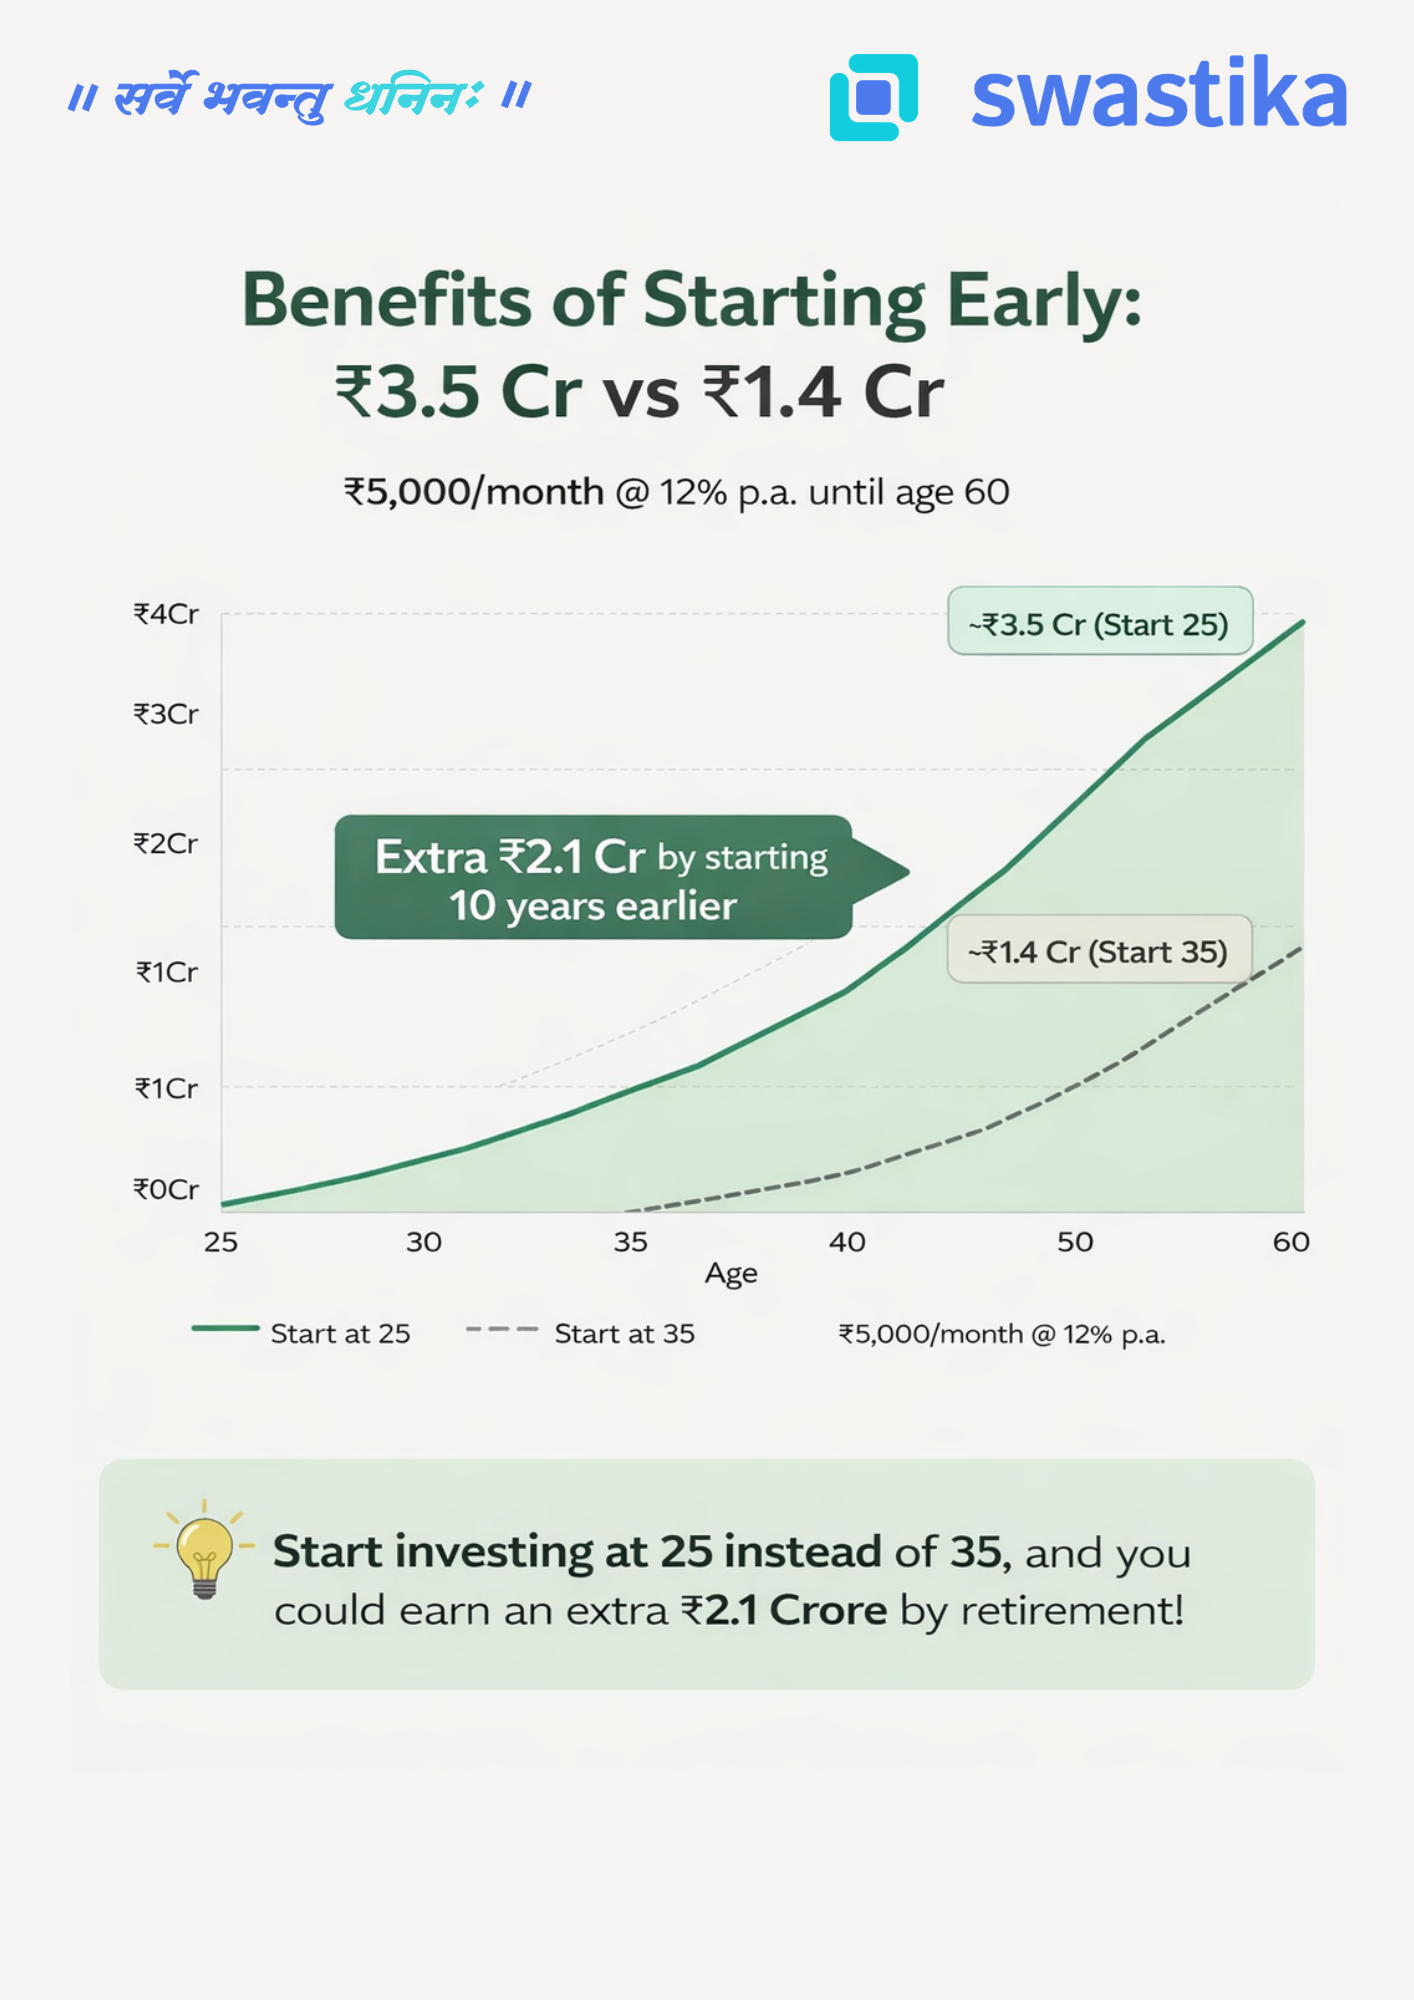
Meet Arjun and Priya. Both are sensible, disciplined investors. Both invest ₹5,000 every month through a SIP (Systematic Investment Plan) in equity mutual funds, earning an average annual return of 12%. Both stop investing at age 60.
The only difference? Arjun starts at 25. Priya starts at 35.
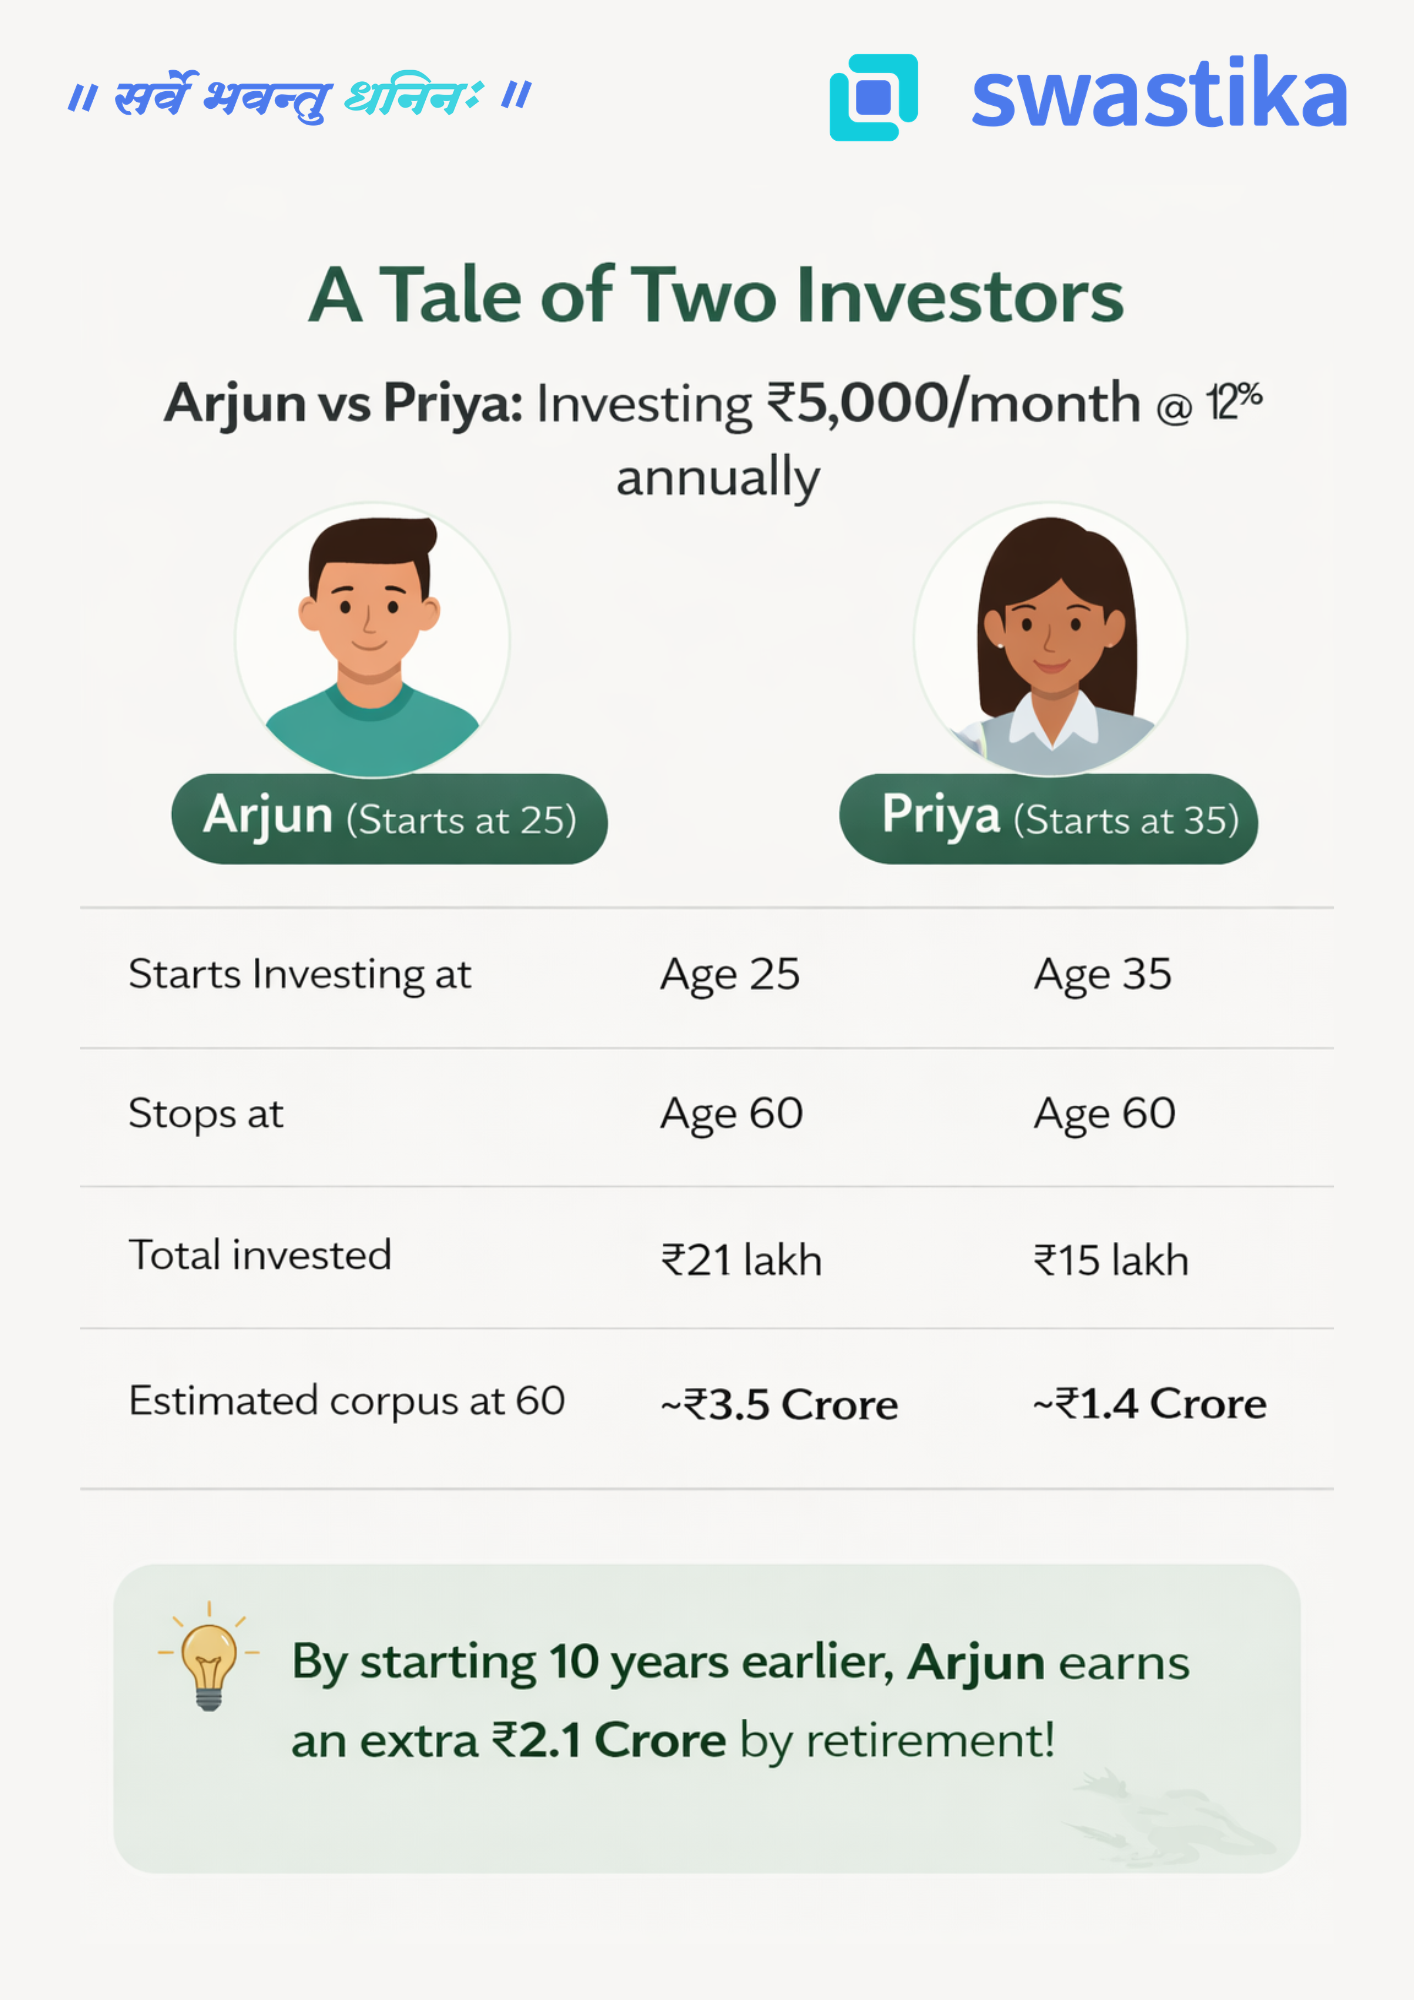
The numbers are striking. Arjun invests just ₹6 lakh more than Priya in absolute terms — yet walks away with ₹2.1 Crore more at retirement.
That extra ₹2.1 Crore didn't come from investing more aggressively or taking bigger risks. It came purely from starting 10 years earlier.
Why Does Time Make Such a Huge Difference?
This is where the magic of compounding reveals itself.
In the early years of investing, growth looks modest and almost unimpressive. But as the years pass, your corpus grows not just on your original investment, but on all the accumulated returns from previous years. The curve goes from almost flat to steeply exponential — and that steep climb happens in the later years.
When Arjun starts at 25, his money has 35 years to ride that exponential curve. Priya's money, starting at 35, only catches the last 25 years — and critically, it misses the steepest part of the climb in the final decade.
Think of it this way: the last 10 years of compounding are worth more than the first 20. That is the counterintuitive truth at the heart of long-term investing.
The Real Cost of Waiting
Many young earners tell themselves, "I'll start investing once I'm more settled — once the salary improves, once the EMI is paid off, once life is a bit easier."
But the numbers show that every year of delay is extraordinarily expensive — far more expensive than any EMI or lifestyle expense. Priya didn't invest carelessly. She invested faithfully for 25 years. Yet she ends up with less than half of what Arjun accumulated — not because she did anything wrong, but simply because she started a decade late.
The cost of waiting 10 years wasn't ₹6 lakh in additional contributions. The cost was ₹2.1 Crore in lost wealth.
Three Principles to Remember
1. Start now, not later.The best time to start investing was yesterday. The second best time is today. Even a SIP of ₹1,000–₹2,000 per month in your 20s is infinitely better than waiting for the "right time."
2. Consistency beats intensity.You don't need to invest large sums all at once. A small, steady, monthly commitment — maintained without interruption — is what unlocks the full power of compounding over decades.
3. Stay invested through market cycles.Compounding works only if you let it work. Exiting during market corrections or stopping your SIP in tough months breaks the chain. Time in the market, not timing the market, is what builds wealth.
The Bottom Line
If you are in your 20s or early 30s, you hold an asset that no amount of money can buy later: time. Use it. Start a SIP today — even a small one. Let compounding do its slow, steady, powerful work.
Because the difference between starting at 25 and starting at 35 is not just 10 years. As Arjun and Priya's story shows, that difference is ₹2.1 Crore.
Big Budget


.webp)
.webp)
.webp)
.webp)
.webp)


.webp)
.webp)
.webp)
.webp)
Latest Articles

AGS Transact Technologies Ltd IPO


Rating AVOID Issue Offer Issue Opens on Jan 19, 2022Issue Close on Jan 21, 2022Total IPO size (cr) 680.00Fresh issue(cr) NilOffer For Sale (cr) 680.00Price Band (INR) 166-175Market Lot 85Face Value (INR) 10Retail Allocation 35%Listing On NSE, BSE
Objects of the issue
- To carry out an offer for sale.
- To achieve the benefits of listing
Issue Break-up (%) QIB Portion 50NIB Portion 15Retail Portion 35 Shareholding (No. of Shares) Pre Issue 120,392,576Post Issue 120,392,576 Indicative Timetable Finalization of Basis of Allotment 27-01-2022Refunds/Unblocking ASBA Fund 28-01-2022Credit of equity shares to DP A/c 31-01-2022Trading commences 01-02-2022
Incorporated in 2002, AGS Transact Technologies Ltd was one of the largest integrated Omni-channel payment solutions providers in India in terms of providing digital and cash-based solutions to banks and corporate clients, as of March 31, 2021.
The company provide customized products and services comprising ATM and CRM outsourcing, cash management and digital payment solutions including merchant solutions, transaction processing services and mobile wallets.
The company operate its business in three major segments: Payment Solutions; Banking Automation Solutions; and other Automation Solutions (for customers in the retail, petroleum, and color sectors).
- It is the second-largest company in India in terms of revenue from ATM managed services and also the largest deployer of POS terminals at petroleum outlets in India.
- It not just serves the Indian market but has also expanded internationally in other Asian countries including Sri Lanka, Cambodia, Singapore, Indonesia, and the Philippines.
- As of August 31, 2021, it had approximately 50 banking customers, including ICICI Bank Limited, HDFC Bank Limited and Axis Bank Limited.
- The company’s colour operations primarily comprise the supply of automatic paint dispensers and related services, and serve customers including Asian Paints Limited, Kansai Nerolac Paints Limited and Berger Paints India Limited.
- As of August 31, 2021, it had installed a network of 221,066 merchant POS, 17,924 petroleum outlets, 72,000 ATMs and CRMs offering cash management services, 46,800 cash billing terminals, and installed 88,521 colour dispensing machines.
The business serves customers in 2200 cities and towns through 446,000 machines or customer touchpoints.
Outlook & Valuation:
The company's revenue has been flat over the last three years, mostly on the declining side where revenue in FY21 fell to Rs 1,797 cr from Rs 1,833 cr in FY20.
The company's profit, on the other hand, has been decreasing. The company's profit fell from Rs 83 cr in FY20 to Rs 54.7 cr in FY21.
The company's margin also shrank. The company is one of India's leading Omni-channel payment solution providers with a strong network.
However, the government's focus on digital payments will further decrease the use and availability of cash can have an adverse effect on business activities.
The IPO is priced at a PE of 38x and P/BV of 3.71x on the NAV of Rs 47.11, which is slightly higher than its listed peers however, they are not comparable on an apple-to-apple basis, also the IPO is purely OFS based. Thus we assign an "AVOID" rating to the IPO.
IPO Note
AGS TRANSACT TECHNOLOGIES LTD
KEY MANAGERIAL PERSONNEL
Mr Ravi B. Goyal is the Chairman and Managing Director of the Company.
He is responsible for the management of the overall operations of the company and its subsidiaries. He has approximately 26 years of experience in the field of technology.
- Mr Stanley Johnson P is an Executive Director on the Board of the Company. He has been instrumental in strengthening and expanding the company’s banking outsourcing operations across India.
- Mr Vinayak R. Goyal is an Executive Director on the Board of the Company. He works closely with management to drive strategic and business initiatives for the Company.
- Mr SaurabhLal is the Chief Financial Officer of the Company and of its Subsidiary, SVIL. He has over 15 years of experience in the financial service industry.
- Mrs Sneha Kadam is the Company Secretary and Compliance Officer of the Company and its Subsidiary, SVIL. She is an associate member of the Institute of Company Secretaries of India. She has over eight years of experience as a company secretary in Indian companies.
- Mr Ricardos El Khoury is the Chief Executive Officer and a director of its Subsidiary, Novus SGP. He has approximately 28 years of experience in the information technology sector.
- Mr Mehernosh Parekh is the Chief Operating Officer and a Director of its Subsidiary, SVIL. He holds a Bachelor of Commerce degree from theUniversity of Bombay. He has work experience in the cash management industry.
COMPETITIVE STRENGTHS
- An integrated omnichannel payment and cash solutions provider.
- Customer Driven Portfolio with Strong Capabilities to Develop Customized Solutions In-house.
- Diversified Product Portfolio, Customer Base, and Revenue Streams Leading to Cross-Selling Opportunities.
- Long-Standing Relationships with Technology Providers and Customers.
- Dedicated In-house Infrastructure and Technological Capabilities.
- Experienced Board of Directors and Senior Management.
KEY STRATEGIES
- Focus on Growing of Digital Payment Solutions Business.
- Focus on Enhancing the Integrated Technology Payments Platform.
- Focus on Cash Management Services and international expansion.
KEY CONCERNS
- Covid -19 epidemic has had and may continue to have some adverse effects on their business.
- A small number of clients account for a large amount of their revenue.
- A decrease in the use of cash as a mode of payment could have an adverse effect on its business.
- Engaged in fee-based activities and their financial performance may be adversely affected by an inability to generate income from such activities.
- The RBI and other government authorities heavily regulate the sectors in which they operate.
IPO Note
AGS TRANSACT TECHNOLOGIES LTD
COMPARISON WITH LISTED INDUSTRY PEERS(AS OF 31st MARCH 2021)
There are no listed companies in India whose business portfolio is comparable with that of the company’s business and comparable to the scale of operations. Hence, it is not possible to provide an industry comparison.
FINANCIALS (RESTATED CONSOLIDATED)
Particulars (Rs. In Millions) FY 2021 FY 2020 FY 2019Equity Share Capital 1,185.81 1,185.81 1,185.81Other Equity 4,400.81 3,803.74 3,063.53Net Worth 5,586.62 4,989.55 4,249.34Gross Debt 16,223.41 11,590.17 11,053.03Revenue from Operations 17,589.44 18,004.43 18,057.42EBITDA 4,767.60 4,954.61 4,428.75Profit Before Tax 824.27 1,195.24 788.89Net Profit for the year 547.92 830.14 661.94
DISCLAIMER
The information contained herein is strictly confidential and are meant solely for the information of the recipient and shall not be altered in any way, transmitted to, copied or distributed, in part or in whole, to any other person or to the media or reproduced in any form, without prior written permission of Swastika Investmart Ltd. (“SIL”).
The contents of this document are for information purposes only.
This document is not investment advice and must not alone be taken as the basis for an investment decision.
Before taking any decision to invest, the recipient of this document must read carefully the Red Herring Prospectus (“RHP”) issued to know the details of SME-IPO and various risks and uncertainties associated with the investment in the IPO of the Company.
All recipients of this document must before acting on the given information/details, make their own investigation and apply independent judgment based on their specific investment objectives and financial position.
They can also seek appropriate professional advice from their own legal and tax consultants, advisors, etc. to understand the risks and investment considerations arising from such investment.
The investor should possess appropriate resources to analyze such investment and the suitability of such investment to such investor’s particular circumstances before making any decisions on the investment. The Investor shall be solely responsible for any action taken based on this document.
SIL shall not be liable for any direct or indirect losses arising from the use of the information contained in this document and accept no responsibility for statements made otherwise issued or any other source of information received by the investor and the investor would be doing so at his/her/its own risk.
The information contained in this document should not be construed as a forecast promise guarantee or assurance of any kind.
The investors are not being offered any assurance or guaranteed or fixed returns on their investments. The users of this document must bear in mind that past performance if any, are not indicative of future results. The actual returns on investment may be materially different from the past.
Investments in Securities market products and instruments included in the IPO of the Company are highly risky and they are generally not an appropriate avenue for someone with limited resources/ limited investment and low-risk tolerance.
Such investments are subject to market risks including, without limitation, price, volatility liquidity and capital risks. Therefore, the users of this document must carefully consider all the information given in the RHP including the risks factors before making any investment in the Equity Shares of the Company.
Swastika Investmart Ltd or its analysts did not receive any compensation or other benefits from the companies mentioned in the report or third party in connection with the preparation of the stock market research report.
Accordingly, neither Swastika Investmart Ltd nor Research Analysts have any material conflict of interest at the time of publication of this report.
The compensation of our Research Analysts is not based on any specific merchant banking, investment banking or brokerage service transactions.
Swastika Investment Ltd may have issued other reports that are inconsistent with and reach different conclusions from the information presented in this report.
The research entity has not been engaged in the market-making activity for the subject company.
The research analyst has not served as an officer, director or employee of the subject company. We have not received any compensation/benefits from the Subject Company or third party in connection with the Research Report.
CORPORATE & ADMINISTRATIVE OFFICE - 48, Jaora Compound, M.Y.H. Road, Indore - 452 001 | Phone 0731 - 6644000
Compliance Officer: Ms Sheetal Duraphe Email: compliance@swastika.co.inPhone: (0731) 6644 241
Swastika Investmart Limited, SEBI Reg. No. : NSE/BSE/MSEI: INZ000192732 Merchant Banking: INM000012102 Investment Adviser: INA000009843 MCX/NCDEX: INZ000072532 CDSL/NSDL: IN-DP-115-2015 RBI Reg. No.: B-03-00174 IRDA Reg. No.: 713.

Why Should Traders Consider a Plough Back Ratio Before Investing?
When a company makes net profits, a portion of the net profits is paid out to the shareholders in dividends.
This is usually referred to as paying some or all of your profits back to shareholders.
Paying out dividends to shareholders of a company will normally receive a portion of those dividends as cash income.
Ploughing back profits is the opposite of paying out dividends. When a company makes net profits, a portion of the net profits is paid out to the shareholders in dividends.
On the other hand, ploughing back profits involves investing its money into its operations rather than distributing it to the shareholders.
Example of Plough Back Ratio of X Ltd and Y Ltd
X Ltd Amount Y Ltd Amount Total Equity Rs.10,00,00,000Total EquityRs.10,00,00,000Net Profits 2017-18Rs.3,30,00,000Net Profits 2017-18Rs.3,30,00,000Dividend PaidRs.66,00,000Dividend PaidRs.33,00,000Dividend Ratio20%Dividend Ratio10%Plough Back Ratio80%Plough Back Ratio90%Market CapitalizationRs.52.80 Crore Market CapitalizationRs.85.80 Crore P/E Ratio16XP/E Ratio26X
In the above example, we can see that both companies X and Y have the same equity base, and we considered that they earned the same profit in the last financial year 2020-2021.
This means both X and Y have the same return on Equity (ROE).
Return on Equity(ROE) = Net Profit of Business / Total Equity of Business.
ROE of X = 3.30 Cr(Net Profit) / 10 Cr(Total Equity) = 33%
ROE of Y = 3.30 Cr(Net Profit) / 10 Cr(Total Equity) = 33%
We have seen both X and Y companies have the same ROE and similar net profits.
But they both differ in the way they pay out dividends.
For example, X pays out 20% of its profits as dividends and ploughs back 80% of profits. On the other hand, we see Y pays out just 10% of its profits as dividends and ploughs back 90% of its profits into its reserves.
What is significant is that X quotes at a P/E ratio of 16X while Y quotes at a P/E Ratio of 26X.
Why is there such a vast difference?
Because Y invests more profits to buy assets and grow as a company and make profit accordingly rather than giving money to shareholders.
To know more about investment in high dividend-paying companies - click here
Why Don't Many Traders Reward High Dividend Paying Companies?
Both companies have the same ROE in the above example, but the Y’s P/E ratio is much higher than X.
Why is it so? Some people like it if the company pays a high dividend, but many don't like dividend-paying companies.
The reason behind that is that when a company gives a high percentage of dividend to shareholders as X did, traders stop investing in that stock because they think that the company should invest the profit into their growth rather than giving high dividend shareholders.
Company Y gives only 10% of its shareholders and invests more of its profit into their growth. That's the reason the Y P/E ratio is 26X
Some people like that they should get the bonus money from the company, i.e., dividend, but these people are very less. The majority of long-term investors don't like dividend-paying companies.
So, Which Company Should you Invest in, X or Y?
X pays out 20% dividends compared to Y's 10% payout. Hence, if you are looking for dividend income, you would prefer investing in X.
But suppose you are a long-term investor who is willing to remain invested for at least ten years and does not mind volatility in the stock price.
Then you would prefer investing in Y because Y invests 90% of profits back into the business, and hence Y will have much more money to grow at a faster rate than X. Thus, your long-term expected return from Y is higher than that of X.
Advantage of Plough back Profits for Traders
Plough back profits is a term used in the corporate world. The number of net profits (or net profit available to shareholders) that a company reinvests back into the business, rather than paying out as dividends.
The reinvestment back into the business is generally done in two ways:
1) Increasing working capital by buying additional inventory and raw materials, paying off debt, and increasing short-term investments.
2) Investing in long-term assets such as new facilities, machinery, and equipment.
The advantage of ploughing back profits into the business, as opposed to paying out dividends to shareholders, is that it allows for the creation of long-term value for the company.
This ultimately helps the share price at some stage in the future.
Conclusion
So the plough back ratio can be beneficial for both short-term traders and long-term traders accordingly. If you are a short-term trader, you should invest in a high dividend-paying company, and if you are a long-term trader, you should invest in a no dividend-paying company or less dividend-paying company.
Is It Good To Buy Low P/E Ratio Stocks?
If you are new to stock trading, you may be wondering what the P/E ratio is. And why it is considered while purchasing stocks. This blog is intended to give you a brief understanding of the P/E ratio.
As a stock market trading investor, you always want to buy undervalued or low P/E ratio stocks.
Trying to understand the reason behind this concept will be helpful to get an idea of what the P/E ratio is and how it works.
As defined, the "Price to Earnings Ratio" or P/E ratio is a valuation indicator that measures the number of money investors pay for each dollar of a corporation's earnings.
It is calculated by dividing the current market price by its earnings per share (EPS).
The P/E ratio can also be stated as "how much an investor pays for one Rupee of earnings".
It gives valuation multiple times higher or lower than the market average. The lower the number, the better the bargain.
So why should you prefer low P/E ratio stocks? To answer this question, we need first to understand how it works.
How does the P/E ratio work?
Low P/E ratio stocks can be considered as blue-chip companies. These are the companies considered to be leaders in their respective fields. They are well established, have a long history and reputation, and have a loyal customer base.
So why should you prefer low P/E ratio stocks?
To answer this question, we need first to understand how it works.
P/E = Price/Earnings Ratio
The P/E ratio is the most commonly used metric for valuing stocks. It's calculated by dividing the market price per share by earnings per share (EPS).
The lower the P/E ratio, the better it is for investors because it means you get more earnings per Rupee spent.
For example, if a company has a P/E ratio of 10, it means you have paid Rs 10 to buy Rs 1 worth of profits (earnings).
Whereas if a company has a P/E ratio of 20, you will have to pay Rs 20 to buy Rs 1 worth of profit. 20 is higher than 10, and hence the former company offers lower value.
Low P/E Stocks = Low-Risk Investment
Now that we know how the P/E ratio works, let's quickly jump into the factors to invest in Low P/E stocks.
Consideration Factors to Buy Low P/E Ratio Stocks
A low P/E ratio could well be a valuation call; it could be a call on the quality of the business.
It is essential to know the reasons for a low P/E ratio before investing in such companies.
If the company is bad, avoiding such companies would be a smart move.
On the other hand, if it is because the market has doubts regarding the future performance of the company, then you must make an independent analysis based on facts before you decide to avoid them or not.
Another example is of Nifty midcap stocks. If you look at the P/E ratios of the NSE Midcap Index and Nifty Smallcap index, you will find that the NSE Midcap index has consistently traded at a lower P/E ratio than the small caps.
The reason for this is straightforward – it is because investors perceive that midcaps are riskier than small caps.
So, a low P/E ratio can be a warning sign, but the P/E ratio cannot use it in isolation to judge companies.
Before forming an opinion on a company, you need to look at other factors like return on equity, interest coverage ratio, debt levels and more.
(Read more about - Factors to be Considered While Choosing Ideal Stocks )
If not P/E, then what should one look at?
There are things you can look at. You can look at the return on equity, which measures profitability. You can look at book value, which measures assets relative to debt.
You can look at the profit margin, which is how much profit you're making relative to sales. And you can look at growth rates.
Some companies have very high P/E's and are also doing extremely well in profitability, asset turnover, and financial risk.
Those things tend to be overlooked as people focus on the P/E ratio alone.
The best way to figure out what's going on with a company is to go through that exercise of looking at all the different factors and then coming up with an overall assessment.
Now, we don't want to say there's no place for the P/E ratio because it tells you something about how expensive stocks are in general.
Still, it doesn't tell you anything about whether a company is cheap or expensive relative to its history or its competitors or its growth rate or its prospects."
Conclusion
Wrapping up, we conclude that you should consider P/E with the combination of factors before buying a Stock, like Return on equity, Asset relative to debt, profit margin etc.

NTPC Seeks RIL Before Going Public
Table of Contents
- Why NTPC Seeks Renewable Unit Investor Before Going Public (IPO)?
- AIM of NTPC.
- Upcoming NREL Renewable Power Projects.
- NTPC Research Report on Renewable Energy assets
- The current installed capacity of NTPC.
- Is it reasonable to buy NTPC stock in 2022?
- What is the Market Cap of NTPC?
Why does NTPC Need a Renewable Unit Investor for IPO?
The country's largest power generator, NTPC, is seeking a partner to help it plan the initial public offering (IPO) of its renewable energy subsidiary National Renewable Energy Lab (NREL).
According to officials aware of the developments. It will start looking for a partner from April 2022, which would help increase the value of its IPO. Although other SME-IPOs are lined up in 2022, the spark of issuing NTPC’s IPO is different from other IPOs.
The reason could be the popularity of NTPC as it is counted as India’s dominant power major with a presence in the entire value chain of power generating business.
If we look into the stock market research, India is the third-largest country that emits greenhouse gases (GHG) globally.
That affects its climate and threatens to reverse the development gains made in recent years. NTPC Seeks renewable units to produce 40 per cent of its total power from non-fossil fuels by 2030.
NREL has doubled its target for clean power generation to 60 gigawatts by 2032.
Experts recommend that NREL bear significant equity money to meet the target, and bringing investors on board would be beneficial.
AIM of NTPC
NTPC is India's most significant power utility with an introduced limit of 67,907.5 MW. It plans to turn into a 130 GW company by 2032. NTPC was established in 1975. NTPC aims to be the world's biggest and best power major.
NTPC has exhaustive Rehabilitation and Resettlement and CSR arrangements incorporated with its core business of setting up power projects and generating power.
NTPC focuses on creating dependable power at cutthroat costs in a supportable way by upgrading the utilization of various energy sources with imaginative eco-accommodating advancements.
Subsequently, NTPC adds to the country's monetary improvement and upliftment of the general public.
Upcoming NREL Renewable Power Projects
- This solar power park is the most ambitious renewable energy project. NREL is working on its mega solar power project in Khavda of Gujarat. With the capacity of 5 Gw of solar energy generation.
- NREL is also looking for other technologies, including solar, wind, biomass, and hydropower. It is also interested in exploring ways to generate clean energy from green methanol and green hydrogen.
- As per reports, NREL is looking to pilot a green hydrogen production project at Vindhyachal thermal power plant in Madhya Pradesh.
NTPC Research Report on Renewable Energy Assets
NTPC is very much situated to benefit from the predictable incomes generated by thermal assets and the development of sustainable power.
An AP/BV proportion of 1.5x for warm ventures brings about a valuation of Rs. 133,000 crore (close to current market capitalization) and no incentive for huge renewable energy (RE) growth plans.
Aside from settling ESG issues, NTPC hopes to market >5GW each year to deliver an 11 per cent CAGR in independent directed values.
RE limit focuses of 15GW/60GW by FY24E/FY32E (NTPC won 15% of RE offers in FY21) would make extensive worth.
Frequently Asked Questions about NTPC
The current installed capacity of NTPC?
The company's installed capacity is 67,907.5 MW (which includes JVs) 7 gas-based, own stations include 24 coal-based, 1 Wind 13 Solar, 1 Hydro, and 1 Small hydro plant.
Under the Joint Venture, NTPC has 9 coal-based, 13 renewable energy projects, and 4 gas-based Projects.
Is it reasonable to buy NTPC stock in 2022?
We are happy to say that the Indian stock market is currently trading at a very low price to its intrinsic value. Sooner or later, people will realize the fact that power stocks like NTPC are like annuity income for a long-term investor.
If one buys PNB or Bank of Baroda with a one-year time horizon, the investors will make a lot of money. I would still advise people to hold on to their stocks until the market comes down and then buy some more for the long term.
What is the Market Cap of NTPC?
NTPC, composed in the year 1975, is a large-cap company with a market cap of Rs 117475.11 Crore and is operating in the power sector.
Conclusion
Several well-known global companies, including energy companies, public companies and pension funds, have made significant contributions to India's renewable energy sector. The government wants more international companies to participate in achieving the clean energy goal.

सख्त मौद्रिक नीति से सोने के भाव पहुंचे एक महीने की ऊंचाई पर।
प्रमुख केंद्रीय बैंकों द्वारा इस सप्ताह अपनी संबंधित बैठकों में अपनी मौद्रिक नीतियों को सख्त करने के बाद कीमती धातुओं में तेज़ी रही और सोने के भाव एक महीने की उचाई पर पहुंच गए। डॉलर जो आम तौर पर सोने के विपरीत चलता है, अमेरिकी फेड और यूरोपियन सेंट्रल बैंक द्वारा अपने कोविड-19 आर्थिक प्रोत्साहन को वापस लेने के बाद फिसल गया।
पिछले सप्ताह सोना 1 प्रतिशत और चांदी 1.7 प्रतिशत तेज़ हुई है। प्रमुख केंद्रीय बैंक उच्च मुद्रास्फीति को नियंत्रित करने के लिए मौद्रिक नीतियों को सख्त कर रहे हैं, साथ ही ओमीक्रॉन कोवीड-19 संस्करण के प्रभाव पर भी नजर रख रहे हैं।
मौद्रिक नीति में सख्ती सोने और चांदी के भाव के लिए नकारात्मक प्रभाव देता है, लेकिन बाज़ारो ने इस खबर को पहले ही भुना लिया था जिसके कारण कीमती धातुओं में तेज़ी रही और डॉलर इंडेक्स में दबाव बना। अमेरिकी फेड के साथ यूरोपियन सेंट्रल बैंक ने भी कोवीड राहत पैकेज में मार्च तक कटौती करने को कहा है।
इस बीच, यूरोपीय सेंट्रल बैंक ने 6 महीनो के लिए नियमित मासिक बांड-खरीद को बढ़ावा दिया जिससे कीमती धातुओं में तेज़ी रही। जबकि फेड द्वारा मार्च 2022 मे 0.75 प्रतिशत ब्याज दर बढ़ाने की योजना है। बैंक ऑफ़ इंग्लैंड ने अपनी ब्याज दरों में 0. 25 प्रतिशत की वृद्धि कर दी है।
जबकि बैंक ऑफ़ जापान ने सरल मौद्रिक नीति रखने के साथ आपातकालीन कोवीड -19 फण्ड को घटाने के सन्देश दिए है। केंद्रीय बैंकों के सख्त मौद्रिक नीति के आत्मविश्वाश से कच्चे तेल का रुझान पिछले सप्ताह तेज़ी का रहा और अमेरिका से बेरोज़गारी दावे के आकड़ो में बढ़ोतरी दर्ज की गई जिसके कारण सोने और चांदी के भाव को सपोर्ट रहा है।
इस सप्ताह सोने और चांदी के भाव पर बुधवार को अमेरिका से जारी होने वाले कंस्यूमर कॉन्फिडेंस और गुरुवार को कोर पीसीई प्राइस इंडेक्स के आकड़ो का प्रभाव रहेगा।
तकनिकी विश्लेषण
इस सप्ताह सोने और चांदी के भाव में निचले स्तरों पर सपोर्ट रह सकता है। सोने में 48200 रुपये पर सपोर्ट और 49000 रुपये पर प्रतिरोध है। चांदी में 61400 रुपये पर सपोर्ट और 63000 रुपये पर प्रतिरोध है।
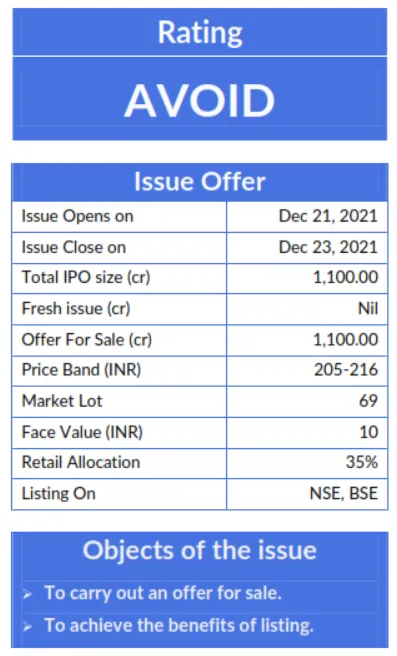
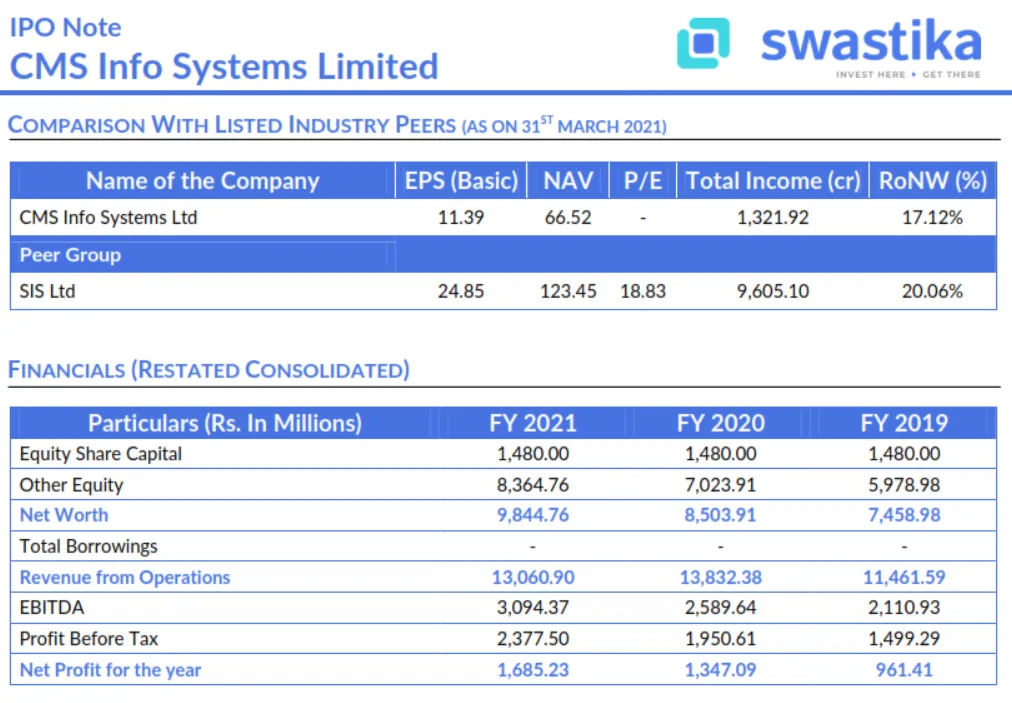
CMS Info Systems Limited IPO : Outlook & Valuation
In December, CMS Info Systems Limited IPO was listed. Incorporated in 2008, CMS Info Systems Limited is India's largest cash management company in terms of the number of ATM points and retail pick-up points as of March 31, 2021.
The company is engaged in installing, maintaining, and managing assets and technology solutions on an end-to-end outsourced basis for banks, financial institutions, organized retail as well as e-commerce companies in India.
CMS Info Systems Limited Business Operates in 3 Segments:
- Cash management services.
- Managed services i.e. banking automation product sales, common control systems, and software solutions, etc.
- Others i.e. financial cards issuance for banks and card personalization services.
In the first place, CMS integrated business platform is supported by customized technology and process controls.
In addition CMS enables it to offer its customers a wide range of tailored cash management and managed services solution.
The Company caters to a broad set of outsourcing requirements for banks, financial institutions, organized retail as well as e-commerce companies in India.
firstly, the demand for cash and cash related services in India has increased, banks and other participants in India are increasingly outsourcing their ATM operations and management.
Secondly, As of August 31, 2021, it has a network of 3,965 cash vans , 238 branches , offices to cover all of India's states , union territories and covering 97.04% of India’s 742 districts, 14,949, or 77.46%, Indian postal codes.
At last the revenue of the cash management market in India grew from approximately ₹10.0 billion in the Fiscal Year 2010 to approximately ₹27.7 billion in the Fiscal Year 2021, a CAGR of 10.88%
Outlook & Valuation:
Despite consistent growth in revenues, we saw a decline in FY21 which can be attributed to COVID-19. According to the company, the revenue in FY20 was Rs. 1388.29 Crores and fell to Rs 1321.92 crore in FY21.
However, the company has improved its net profit from Rs. 134.7 crore in FY 20 to Rs. 168.52 crore in FY 2021. Also the company has stable financial performance and increasing margins.
In the first place, the risk of market volatility needs to be considered right now on the back of rising cases from the omicron variant.
As the government focuses on digital payments, a further decrease in the use and availability of cash can have an adverse effect on business activities.
The IPO is priced at a PE of 19x to its FY21 EPS of Rs 11.09 and a P/BV of 3.24x on the NAV of Rs 66.52, which is in line with its listed peers. Thus we assign an "Avoid" rating to the IPO.
KEY MANAGERIAL PERSONNEL
- Shyamala Gopinath is the Chairperson and an Independent Director of the Company. She has been associated with the Company since November 13, 2017. In the past, she has served as the Deputy Governor of the RBI
- Rajiv Kaul is the Executive Vice Chairman, Whole Time Director and CEO of the Company. He is currently heading the Company and is responsible for the overall management of the Company. He has over 24 years of experience across technology, private equity and cash management industry.
- Pankaj Khandelwal is the President and Chief Financial Officer of the Company. He is currently responsible for the finance, legal as well as secretarial functions of the Company. He is a qualified chartered accountant from ICAI with over 27 years of experience.
- Praveen Soni is the Company Secretary and Compliance Officer of the Company. He has been associated with the Company since July 1, 2009. He has over 16 years of experience in secretarial as well as legal practices.
- Manjunath Rao Pare Parmeshwar is the President- Managed Services Business. He has been associated with the Company since July 6, 2012. He has over 34 years of experience in sales and marketing across sectors.
- Anush Raghavan is the President- Cash Management Business of the Company. He has over 14 years of experience in business management and business development.
- Sanjay Singh is the Chief Human Resources Officer of the Company. He has been associated with the Company since July 26, 2021
- Rohit Kilam is the Chief Technology Officer of the Company. He has over 20 years of experience in IT across sectors.
COMPETITIVE STRENGTHS
- Leading player in a consolidating market with strong fundamentals.
- Pan-India footprint with deep penetration in growing markets.
- Longstanding customer relationships with increased business opportunities.
- Integrated business platform offering a broad range of services and products.
- Track record of strong productivity and operational excellence.
- Experienced and highly qualified management team.
KEY STRATEGIES
- Drive operational efficiencies and increase profitability.
- Expand into business areas that create synergies with the current business.
- Enhancing the organizational capabilities.
KEY CONCERNS
- Company entire IPO proceeds (Rs 1,100 Crores) is Offer for Sale.
- India has moved to digitization post demonetization.
- The company business is highly dependent on the banking sector in India.
- Company business has affected by covid-19 pandemic and it can affect in future too.
- The company derives a substantial portion of its revenue from the limited number of customers.


.webp)
.webp)

.webp)


START YOUR INVESTMENT JOURNEY
Get personalized advice from our experts
- Dedicated RM Support
- Smooth and Fast Trading App
