
Ola Electric Share Price Momentum: ola electric share price Signals Across Four Nifty500 Stocks


Key Takeaways
- Four Nifty500 stocks showed bullish RSI uptrends on June 30, 2026, with gains over 4%.
- Balrampur chini mills stock posted the highest RSI at 57.42 and CMP Rs 554.95.
- ola electric share price momentum: ola electric stock RSI 56.63; coromandel international stock price RSI 56.48; stock price of cochin shipyard RSI 53.67 with CMPs Rs 43.76, Rs 2,005, and Rs 1,507.9 respectively.
- RSI trending up signals momentum; use it with price action and risk controls.
On June 30, 2026, four stocks from the Nifty500 segment gained over 4% in an RSI Trending Up scan, based on data from StockEdge.com. The RSI trend-up occurs when the Relative Strength Index crosses above 50 from below, a classic signal that momentum is strengthening in price action. In this cluster, the ola electric share price momentum sits alongside peers in a broader rally. The four stocks highlighted were balrampur chini mills stock, ola electric stock, coromandel international stock price, and stock price of cochin shipyard. Retail investors across India are watching these momentum signals as a possible filter for further upside, while also considering risk controls and market context.
The figures below originate from StockEdge.com’s RSI Trending Up data. A cross above 50 from below signals that buyers have regained control after a period of consolidation. In this set, the RSI values moved higher from their prior readings, suggesting strengthening upward momentum in trading sessions around June 30, 2026. The following values summarize the momentum snapshot for each stock:
| Stock | RSI | Prev RSI | CMP (Rs) |
|---|---|---|---|
| balrampur chini mills stock | 57.42 | 45.76 | Rs 554.95 |
| ola electric stock | 56.63 | 45.47 | Rs 43.76 |
| coromandel international stock price | 56.48 | 48.07 | Rs 2,005 |
| stock price of cochin shipyard | 53.67 | 42.8 | Rs 1,507.9 |
Interpreting these numbers, balrampur chini mills stock posts the highest RSI among the quartet at 57.42, followed closely by ola electric stock at 56.63 and coromandel international stock price at 56.48. The stock price of cochin shipyard sits a bit lower at 53.67. The current market prices (CMP) reflect a diverse set of market caps within the Nifty500; balrampur chini mills stock trades around Rs 554.95, ola electric stock around Rs 43.76, coromandel international stock price around Rs 2,005, and stock price of cochin shipyard around Rs 1,507.9. This distribution suggests momentum was broadly positive on that date, with strength concentrated in mid-cap to large-cap sectors represented in the quartet.
For investors tracking momentum signals, this RSI uptrend snapshot highlights a pattern: when RSI crosses above 50 from below, additional upside is not guaranteed, but momentum tends to be more favorable in the near term. The four stocks listed here demonstrate how a momentum-based screen can surface opportunities across diverse sectors like sugar, mobility, agri-chemicals, and shipbuilding. If you want deeper, institution-level research on ola electric share price and peers, Swastika’s Sarthi AI stock assistant can help you evaluate scenarios and valuations in real time.
Ola Electric Share Price: ola electric share price RSI Uptrend Across Four Nifty500 Stocks
This section focuses on the primary momentum signal and how it manifests in the four stocks. The RSI Trending Up signal is triggered when RSI crosses above the 50 threshold from a lower level, indicating rising buying pressure and a potential up-move in price. In the June 30 data, the ola electric share price is part of a cluster with robust momentum indicators: the stock recorded RSI 56.63, up from Prev RSI 45.47, with a current price around Rs 43.76. The other three stocks show similar momentum strength, reinforcing the idea that a broad sector recovery or rotation could be contributing to sustained demand in this segment. When assessing the uptrend, it’s essential to consider price action, liquidity, and macro factors that influence Indian markets as retail participation widens.
In practical terms, RSI values in the mid-50s to high-50s range (as seen with ola electric stock and its peers) suggest traders are warming to the idea of higher prices, especially when the price action confirms the cross above 50. Traders often combine RSI with moving averages, volume patterns, and fundamental context to avoid over-reliance on a single indicator. For the current moment, the four stocks that flashed the RSI Trending Up signal present a useful watchlist for momentum-focused investors to compare relative strength and potential entry points.
Stock-level Momentum Snapshot: Balrampur chini mills stock, ola electric stock, coromandel international stock price, stock price of cochin shipyard
From a stock-level perspective, the highest RSI belongs to balrampur chini mills stock at 57.42, signalling the strongest near-term momentum among the four. ola electric stock sits close behind with 56.63, while coromandel international stock price registers 56.48. The stock price of cochin shipyard is at 53.67 RSI, indicating solid momentum yet relatively softer than the other three. The corresponding CMP readings–Rs 554.95 for balrampur chini mills stock, Rs 43.76 for ola electric stock, Rs 2,005 for coromandel international stock price, and Rs 1,507.9 for stock price of cochin shipyard–provide a quick reference on where the market currently prices these momentum signals. Traders should monitor how RSI holds above 50 as the next price action unfolds, and whether price patterns corroborate the momentum in subsequent sessions.
How Retail Investors Can Use RSI Uptrend Signals With Risk Management
RSI Uptrend signals, defined by crossing above 50, are most meaningful when paired with confirmation from price action and volume. In this instance, the four stocks showed momentum uplift on a single day; sustained rallies typically require follow-through days and supportive macro conditions. Retail investors should consider setting clear entry and exit rules, such as using a moving-average cross or a stop-loss based on recent swing lows, to avoid being swept into fleeting moves. With ola electric share price and the other three stocks, you could watch for consolidation beneath nearby resistance levels and rising accumulation signals before initiating a position. Remember that the momentum signal alone is not a guarantee; a disciplined risk framework remains essential for long-term capital protection.
Frequently Asked Questions
What does RSI Trending Up indicate for momentum in these four stocks?
RSI Trending Up indicates RSI values rising above 50 from below, suggesting strengthening momentum in price action. On June 30, 2026, four Nifty500 stocks showed this pattern according to StockEdge.com data.
Which four stocks were flagged in the RSI Trending Up scan on June 30, 2026?
balrampur chini mills stock, ola electric stock, coromandel international stock price, and stock price of cochin shipyard were flagged.
What were the RSI values for each stock in the scan?
balrampur chini mills stock 57.42; ola electric stock 56.63; coromandel international stock price 56.48; stock price of cochin shipyard 53.67.
What are the current market prices (CMP) for these four stocks?
balrampur chini mills stock Rs 554.95; ola electric stock Rs 43.76; coromandel international stock price Rs 2,005; stock price of cochin shipyard Rs 1,507.9.
Where did these RSI numbers come from?
The RSI values come from StockEdge.com data as cited in the RSI Trending Up scan.
How should a retail investor use RSI Uptrend signals in practice?
RSI Uptrend signals should be used in conjunction with price action, risk management, and other indicators to build a robust entry/exit plan.
Conclusion
The momentum seen on June 30, 2026, in the RSI Trending Up cluster is a snapshot of relative strength that may indicate continued upside for a short-to-medium horizon. For retail investors, the key takeaway is not to chase momentum blindly, but to monitor which names sustain RSI above 50 and how price action confirms the move. The four stocks–balrampur chini mills stock, ola electric stock, coromandel international stock price, and stock price of cochin shipyard–showcase varied but synchronized momentum patterns, offering a practical watchlist for momentum-aware traders across India. One actionable next step is to build a watchlist, track RSI for these names, and apply a risk-managed entry plan when RSI remains above the 50 level and price action confirms a breakout from consolidation.
Latest Articles

What is a Circuit Breaker?


A circuit breaker in the stock market is a mechanism that sets a price band within which a stock can be traded on a given day. Circuit breakers operate automatically by halting trading when global exchange values reach predetermined levels. This band includes a lower limit (lower circuit) and an upper limit (upper circuit).
Why is a Circuit Breaker Needed?
Stock prices often fluctuate due to market sentiments, influenced by positive or negative news. Circuit breakers are set up to prevent extreme price movements, protecting investors from sudden, unexpected changes. They also help reduce price manipulation to some extent.
The Securities and Exchange Board of India (SEBI) has defined various circuit levels: 2%, 5%, 10%, and 20%. These levels are based on the stock's closing price from the previous day.
Example:
If XYZ stock closed at ₹100 yesterday and has a 10% circuit limit, today it can only be traded between ₹90 (lower limit) and ₹110 (upper limit). If the stock reaches either limit, trading is halted.
How Circuit Breakers Work
In the trade world, a circuit breaker serves the same purpose as it does in residential electrical circuits. It engages and cuts the circuit when it senses an overload. Circuit breakers are emergency safeguards in the trading industry put in place by stock markets to temporarily or permanently halt trading activity when market prices decline drastically.
Individual Stocks:
If the price hits the upper or lower limit, trading in that particular stock is halted.
Market Indices:
A 10%, 15%, or 20% change triggers a market-wide halt.
Upper and Lower Circuit Limits
The limits prevent excessive speculation and volatility. Depending on the stock category, a stock can shift by 5%, 10%, or a maximum of 20% during a trading day.
Example of Upper Circuit and Lower Circuit
Let's say XYZ stock closed at ₹100 yesterday. If it has a 10% circuit limit:
- Upper Circuit: The upper limit would be ₹110 (10% above ₹100). If the stock price reaches ₹110, trading is halted because it has hit the upper circuit. This indicates strong buying interest, and the price can't go higher for the rest of the day.
- Lower Circuit: The lower limit would be ₹90 (10% below ₹100). If the stock price drops to ₹90, trading is halted because it has hit the lower circuit. This indicates strong selling pressure, and the price can't go lower for the rest of the day.
Market-Wide Circuit Breakers
Time-Based Rules:
- Before 1 PM: A 15% movement halts the market for 1 hour and 45 minutes, followed by a 15-minute pre-opening session.
- Between 1 PM and 2 PM: A 15% movement halts the market for 45 minutes, followed by a 15-minute pre-opening session.
- After 2 PM: A 15% movement halts the market for the rest of the day.
- At Any Time: A 20% movement halts the market for the entire day.
Summary Table of Circuit Breaker Durations

Conclusion
Circuit breakers play a important role in stabilizing the stock market by preventing excessive volatility and protecting investors from sudden, significant price changes.

Understanding Market Capitalization: Meaning, Importance
Ever wondered how much a company is "worth"? The answer lies in a key metric: Market Capitalization. In the stock market, it shows a company's total value based on its current share price and the number of shares available for trading. Instead of looking at revenue or total asset worth, investors use this number to assess a company's size. The market capitalization of a takeover candidate aids in evaluating whether the acquirer will receive a decent deal from the deal.
Formula:
Market Cap = Current Share Price * Total Outstanding Shares
So, if Company W share price is Rs. 200 and there are 5 crore outstanding shares, its Market Cap would be Rs. 1,000 crore (200 * 5 crore).
Why does it matters?
It gives you a snapshot of where a company stands:
- Growth Potential: A smaller company might be newer and have more room to grow, making it an attractive option for growth investors.
- Stability: Larger companies are more stable and less affected by market fluctuations. They often have more financial reserves to cover losses and recover from downturns.
- Risk and Volatility: Small-cap companies can offer high growth potential but come with higher risk and volatility. Large-cap companies are generally more stable but may grow more slowly.
Using Market Capitalization to Diversify Your Portfolio
Diversification is about spreading your investments to manage risk:
- Across Asset Classes: For example, investing in both stocks and bonds.
- Within Asset Classes: Investing in a mix of small-cap, mid-cap, and large-cap stocks to balance potential risks and returns.
Types of Companies
Companies are categorized into different types based on their market capitalization. This helps investors balance their portfolios to minimize risk.
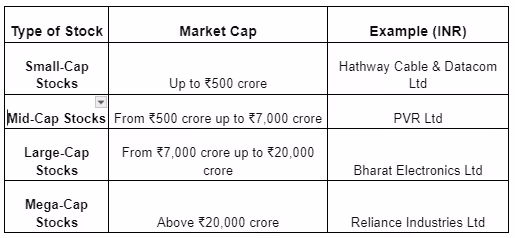
Categories
Small-Cap Stocks
- Market Cap: Up to ₹500 crore.
- Growth Potential: Small-cap companies are often in their early stages and have growth potential. However, they are also more risky.
- High Risk, High Reward: These companies can offer high returns during favorable economic conditions but are more affected by market fluctuations and economic downturns.
- Examples: Hathway Cable & Datacom Ltd.
Mid-Cap Stocks
- Market Cap: From ₹500 crore up to ₹7,000 crore.
- Balanced Growth: Mid-cap companies have a balance between growth potential and stability. They are more established than small-cap companies but still have space for growth.
- Moderate Risk: These companies are less risky than small-caps but more volatile than large-caps. They can provide returns with moderate risk.
- Examples: PVR Ltd.
Large-Cap Stocks
- Market Cap: From ₹7,000 crore up to ₹20,000 crore.
- Stability: Large-cap companies are well-established and financially sound. They are market leaders with a proven track record.
- Lower Risk, Steady Returns: These companies offer more stability and are less likely to experience volatility. They are suitable for conservative investors seeking steady returns.
- Examples: Bharat Electronics Ltd.
Mega-Cap Stocks
- Market Cap: Above ₹20,000 crore.
- Market Dominance: Mega-cap companies are the largest and dominant in their industries. They are often multinational corporations with influence on the market.
- Very Low Risk: These companies provide the highest level of stability and are considered safe investments. While the growth potential might be lower, they offer reliable returns and are ideal for risk-avoid investors.
- Examples: Reliance Industries Ltd.
Conclusion
Market capitalization is an important factor in evaluating stocks and mutual funds. It helps investors take decisions based on their risk tolerance and return expectations. However, while it is a valuable indicator of a company’s financial health, investors should not rely solely on it. A thorough analysis of the company’s overall performance and market conditions is essential before making investment decisions.

How Do Election Results Impact the Indian Stock Market?
Elections are crucial events in any democracy, and India is no exception. The outcomes of elections can have significant impacts on the stock market. This blog explores how election results influence the Indian stock market and what the potential impacts of Prime Minister Narendra Modi’s third term could be.
Political Factors Affecting the Stock Market
Market Sentiment and Stability:
- Market Sentiment: Elections often bring a sense of uncertainty. Investors generally prefer stability, and election outcomes can either boost or reduce their confidence. If the results are in favor of a party or leader perceived to be business-friendly and stable, the market reacts positively.
- Policy Predictability: Stable governments are often able to implement policies more predictably. Investors like predictability as it reduces the risks associated with sudden policy changes.
Economic Policies:
- Pro-Growth Policies: If the elected government has a track record or a plan focusing on economic growth, infrastructure development, and business-friendly regulations, the stock market usually reacts positively.
- Reform Initiatives: Governments promising and delivering structural reforms (like tax reforms, deregulation, and infrastructure spending) can boost investor confidence and drive market rallies.
Fiscal Management:
- Budget and Spending: Election outcomes can impact fiscal policies. Governments that promise sensible fiscal management and reduced deficits tend to be favored by the markets.
- Spending Programs: Conversely, if a new government is expected to increase public spending significantly without a clear plan for managing the budget, it may cause concern among investors about inflation and fiscal health, potentially leading to market volatility.
Global Perception:
- Foreign Investments: Global investors closely watch Indian elections. A government perceived as stable and reform-oriented can attract more Foreign Direct Investment (FDI) and Foreign Institutional Investment (FII), positively influencing the stock market.
- Geopolitical Stability: Election results that contribute to regional stability or enhance diplomatic relations can positively impact the stock market.
Narendra Modi’s Potential Third Term and Its Impact
Prime Minister Narendra Modi, known for his strong leadership and decisive economic policies, could significantly impact the stock market if he secures a third term. Here’s how:
Continuation of Economic Reforms:
Modi’s government has been known for several landmark economic reforms such as the Goods and Services Tax (GST), Insolvency and Bankruptcy Code (IBC), and digitalization initiatives. A third term could mean the continuation and deepening of these reforms, providing a stable and predictable policy environment that is likely to be welcomed by investors.
Infrastructure and Development Projects:
Modi’s focus on infrastructure development, including projects like smart cities, improved transportation networks, and digital infrastructure, could continue. These initiatives can stimulate economic growth, create jobs, and increase demand in various sectors, positively influencing the stock market.
Foreign Investment and Economic Relations:
Under Modi’s leadership, India has improved its ease of doing business rankings and attracted significant foreign investments. A third term could further strengthen India’s global economic relations, encouraging more foreign investments and boosting market confidence.
Political Stability:
A third term for Modi could imply political stability, which is generally favorable for the stock market. Stability reduces uncertainty and helps in long-term planning for both domestic and foreign investors.
Focus on Technology and Innovation:
Modi’s government has also emphasized technology and innovation through initiatives like Digital India and Make in India. Continued focus in these areas could foster a more robust tech ecosystem, providing growth opportunities for tech stocks and start-ups.
Potential Risks:
Implementation Risks: While Modi’s policies are generally market-friendly, the actual implementation of large-scale reforms can sometimes face hurdles, leading to temporary market fluctuations.
Global Economic Conditions: The global economic environment can also impact the effectiveness of Modi’s policies. Trade wars, global slowdowns, or geopolitical tensions can affect market performance regardless of domestic policies.
Conclusion
Election results have a deep impact on the Indian stock market, primarily due to changes in market sentiment, policy direction, and fiscal management. A potential third term for Prime Minister Narendra Modi is expected to bring continued economic reforms, infrastructure development, and political stability, all of which are likely to positively influence the stock market. However, investors should remain mindful of implementation challenges and global economic conditions that can also affect market dynamics. As always, a balanced and insightful approach to investing is crucial in navigating the impacts of election results on the stock market.
Learn more about stock market with Swastika!

What is Prospectus?
A prospectus is a formal document that gives information about an investment offering to the public and is required by the Securities and Exchange Commission (SEC) to be filed. Bonds, mutual funds, and stock offers need the filing of a prospectus. Because it includes a wealth of pertinent information about the investment or security, the prospectus can assist investors in making better-informed investing decisions.
- Preliminary Prospectus
This is the initial offering document provided by the company. It contains most details about the business and the transaction. However, it doesn't include the number of shares or the price.
- Final Prospectus
This document provides all the details of the investment offering to the public. It includes background information, the number of shares or certificates to be issued, and the offering price.
Prospectus Example
In mutual funds, the prospectus covers objectives, investment strategies, risks, and performance, fees, and fund management details.
Requirements for Issuing a Prospectus
To issue a prospectus, a company must:
- File it with local regulatory bodies like SEBI and stock exchanges.
- It must be dated and signed.
- Include all necessary information outlined in the Companies Act 2013.
- Avoid providing misleading information.
Why Read a Prospectus? Here's Why It Matters:
An SEC-mandated prospectus gives investors crucial information regarding an offering of securities.
It disseminates risk information to the public and compiles important details about the investment and the business being invested in.
Investors should take into account the type and degree of risk involved, which is why those facts are usually included early in the prospectus and in more depth later on.
Investors want to know that the firm they are investing in is financially stable enough to fulfill its obligations, therefore the financial standing of the business is also crucial.
Types of Prospectuses
- Red Herring Prospectus: Filed with the registrar before offering shares. Usually lacks details like quantity or price.
- Abridged Prospectus: A brief summary with essential offer details. Must include all documents needed for purchasing the security.
- Deemed Prospectus: Considered deemed if it details the company’s investment offer to the public.
- Shelf Prospectus: Distributed by banks or financial institutions, containing details of multiple investment types.
Details Included in a Prospectus
A prospectus contains the following details:
- Company Information: Name, registered office address, objectives, and background.
- Offer Details: Number of shares or certificates to be issued, offering price, and any minimum subscription amount.
- Financial Information: Audited financial reports, including profit and loss statements, balance sheets, and cash flow statements.
- Management Details: Information about the company's directors, management team, and key personnel.
- Risk Factors: An overview of the risks associated with the investment, including market risks, regulatory risks, and operational risks.
- Legal and Regulatory Information: Details of any legal proceedings, regulatory compliance, and agreements relevant to the offering.
- Use of Proceeds: How the funds raised from the offering will be used by the company.
- Fees and Expenses: Details of any fees, expenses, or charges associated with the investment, including management fees and transaction costs.
- Offering Structure: Any special terms or conditions of the offering, such as underwriting arrangements or distribution channels.
- Other Relevant Information: Any additional information deemed relevant to investors, such as industry trends, competitive landscape, and future growth prospects.
Conclusion
By reading the prospectus carefully, you can:
- Compare different investment options.
- Spot any potential risks.
- See if the investment aligns with your goals and risk tolerance

What is a Covered Call? Overview of a Covered Call Strategy
As an investor, navigating the stock market can often involve balancing potential profits with risks. One strategy that stands out for its is the Covered Call Strategy. This approach allows you to generate income from your stock holdings Let's dive into what a covered call is and how this strategy can benefit you as an investor.
Understanding a Covered Call Strategy
Imagine you own shares of a company. You believe the stock may rise in the long run but don't expect gains in the near term. However, you still want to earn some income from these shares in the meantime. This is where a covered call strategy comes in
In a covered call strategy, an investor sells a call option on a stock they already own. This nets them a premium from the sale of the option. the call option is sold as an Out of The Money (OTM) call, meaning the option's strike price is higher than the current stock price. The call option would not get exercised unless the stock price increases above the strike price. Until then, the investor retains the premium as income, making this strategy attractive for those who are neutral to moderately bullish about their stock.
How a Covered Call Strategy Works
To use a covered call option strategy, you must first own the stock of a company. Let's assume you already hold the stock, showing a bullish movement. Over time, you become unsure about the stock's short-term upside potential and don't expect a significant price increase. Here's what you can do:
- Sell a Call Option: You sell a call option contract at a strike price higher than your stock's purchase price. The buyer of the call option pays you a premium for this contract.
- Collect the Premium: Regardless of whether the option is exercised, you keep the premium. This becomes your immediate income from the stock.
- Outcome Scenarios: After executing a covered call strategy, one of three scenarios can occur:some text
- Stock Price Remains Stable or Falls: The call option expires worthless, and you keep both the premium and your shares.
- Stock Price Rises Slightly: The stock price increases but remains below the strike price. The call option still expires worthless, allowing you to keep the premium and benefit from the stock's appreciation.
- Stock Price Rises Significantly: The stock price rises above the strike price. The call option is exercised, and you must sell your shares at the strike price. You keep the premium and receive the strike price for your shares, potentially missing out on further gains beyond the strike price.
When to Use a Covered Call
The covered call strategy works particularly well in the following situations:
Generating Income
The primary use of the covered call strategy is to generate income. If you own assets like stocks or ETFs that you're willing to sell at a certain price, selling a covered call can help generate additional income.
Neutral or Slightly Bullish Market
The covered call strategy is effective in a neutral or slightly bullish market. If you expect the price of an asset to remain relatively stable or increase slightly, selling a covered call can allow you to generate income while still owning the asset and benefiting from modest price increases.
Reducing Risk/Hedging
By selling a call option, you can theoretically limit downside risk if the price of the underlying stock falls. If the stock price drops below the strike price of the call option, the option will expire worthless, and you'll still own the underlying stock, which you can sell or hold for potential future gains.
When to Avoid a Covered Call
A covered call should be avoided in the following situations:
Expecting a Stock Price Rise
If you expect the stock to rise significantly in the near future, selling a covered call may limit your potential upside. It's better to hold onto the stock and let it appreciate.
Facing Serious Downside
If the stock looks like it's going to drop significantly, using a covered call to get extra cash might not be wise. In such cases, it’s probably best to sell the stock or consider short selling to profit from its decline.
Advantages of a Covered Call Strategy
- Generates Income: Covered calls generate income from holdings that wouldn't otherwise provide a cash flow stream.
- Adds to Returns: Investors periodically sell covered call options to enhance a position's return.
- Acts as a Hedge: A covered call offers some protection by reducing the breakeven price due to the premium.
- Low-Risk Strategy: Selling covered calls is easy and low-risk because the stock position "covers" the short call.
Conclusion
In summary, covered calls can be a strategy for investors looking for risk management and income generation. By merging stock ownership with the sale of call options, investors can increase their potential returns in a moderate appreciation of stock price. This strategy provides a balance between earning additional income and managing risks, making it a valuable tool for an investor.
Learn more about financial terminologies with Swastika!

How to Use Open Interest for Intraday Trading
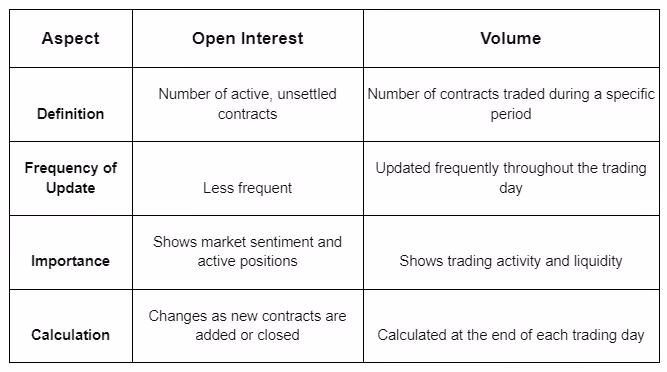
What is Open Interest?
Open interest refers to the total number of outstanding options and futures contracts that have not been settled, closed out, or exercised. In simple terms, it's the number of active positions in options and futures contracts. For example, if a buyer and a seller enter into a new call option contract, open interest increases by one. Conversely, if the same buyer and seller close their contract by taking an opposite position, open interest decreases by one. If the buyer sells their contract to another buyer, the open interest remains unchanged, as there is no net change in open positions.
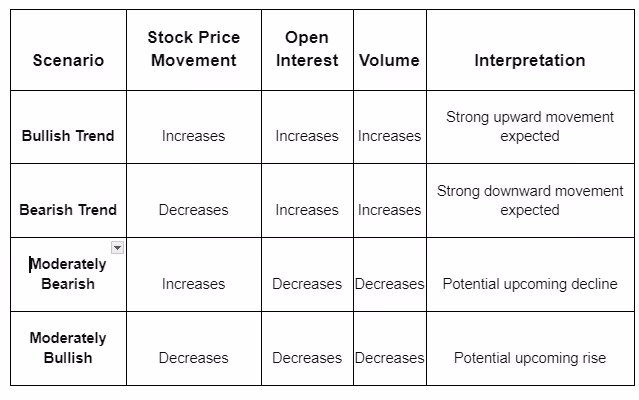
How to Use Open Interest for Intraday Trading
- Bullish Trend: If the stock price rises along with an increase in open interest and volume, it shows a bullish trend.
- Bearish Trend: If the stock price falls along with an increase in open interest and volume, it shows a bearish trend.
- Moderately Bearish: If the stock price rises but open interest and volume decrease, it shows a moderately bearish trend.
- Moderately Bullish: If the stock price falls but open interest and volume decrease, it shows a moderately bullish trend.
Open Interest vs. Volume
Importance of Open Interest
Monitoring open interest provides valuable insights for making decisions in financial markets. Here are some key points:
- Market Sentiment Indicator: Changes in open interest shows bullish or bearish sentiment of the market.
- Price Trend Confirmation: Rising open interest signal uptrends, while falling open interest may signal downtrends.
- Reversal Indication: Sudden changes in open interest can hint at trend reversals.
- Liquidity and Trading Activity: High open interest shows increased market liquidity and trading activity.
- Options Expiry Consideration: Important in options trading, helps in influencing decisions around expiry dates.
- Contrarian Indicator: Analyses extreme open interest situations for potential contrarian trading opportunities.
Example in INR
Suppose an investor is tracking a stock with the following details:
- Current Stock Price: ₹500
- Open Interest: 10,000 contracts
- Volume: 5,000 contracts
Conclusion
By analyzing open interest along with volume and price action, you can identify market trends. Once you've identified the trend, you can take appropriate positions. To get specific open interest data for an asset, use an open interest calculator, which is often available online for free.
Big Budget


Popular Articles


.avif)
.avif)

.avif)


START YOUR INVESTMENT JOURNEY
Get personalized advice from our experts
- Dedicated RM Support
- Smooth and Fast Trading App
