
Wipro Share Price And The ADR Drop: What Retail Investors Should Watch In 2026


Key Takeaways
- Wipro ADRs plunged as much as 17% overnight, jolting the wipro share price.
- The stock trades around Rs 170.35, far from its 52-week high of Rs 369.93 touched in October 2021.
- Analysts point to North American macro headwinds and AI-driven disruption as key sector risks.
- Retail investors should apply risk controls, maintain a watchlist, and use a structured plan for IT exposure.
Wipro Share Price: ADR Slump Triggers Investor Caution Across Indian IT
Wipro ADRs plunged as much as 17% overnight, turning a quiet session into a critical test for the wipro share price and the millions of retail investors who track it. The price action comes as larger AI and macro headwinds weigh on the IT services sector, with North American demand and discretionary technology budgets under pressure. In this piece, we unpack what the ADR slide implies for the wipro share price, how the stock has fared against its 52-week high, and what investors should watch next as earnings season looms.
At its current level, Wipro stock trades around Rs 170.35 in regular trading, a far cry from its record highs near Rs 369.93 touched in October 2021. The ADR decline underscores the broader skepticism around IT services as large deals slow and discretionary technology budgets tighten. The immediate takeaway for traders is not a one-day story but a signal of headwinds across the growth cycle. Investors should watch how the stock moves in response to quarterly results and commentary on demand in core markets.
Beyond the headline move, consider the multi-year context. Wipro has fallen about 54% from its peak, underscoring how sentiment about the IT services space has shifted since late 2021. The stock’s price trajectory reflects a combination of tougher demand in North America, competitive pressure, and a higher bar for earnings growth that many investors now demand before allocating capital to large IT services names.
North American Demand Headwinds Impacting Indian IT Stocks
North America remains the biggest market for Indian IT services firms, making the region a pivotal determinant of revenue and earnings. In the current cycle, macroeconomic headwinds in that geography–ranging from tighter corporate budgets to cautious client spending–have clouded the near-term growth outlook for Wipro and peers. When buyers slow discretionary technology investments, delivery teams face compressed pricing, longer sales cycles, and a heavier emphasis on efficiency rather than expansion. The ADR move in Wipro thus fits into a broader narrative where investors reassess growth visibility in a market sensitive to macro shifts.
From a practical standpoint, this reality translates to a more scrutinized earnings outlook and an emphasis on rate of AI-led productivity gains versus pure headcount expansion. As clients demand more value per dollar, IT firms must demonstrate not just a pipeline of new deals but a credible path to higher margins through automation, offshore optimization, and scalable digital offerings. The market is asking hard questions: can Wipro sustain margins while investing in AI-enabled capabilities, and will North American demand stabilize enough to offer credible upside in FY27?
AI Adoption In IT Services: Generative AI And The Revenue Path
Artificial intelligence, particularly generative AI, is increasingly reshaping the IT services landscape. DBS Bank notes that the impact of AI is becoming most evident in India’s large IT services and outsourcing sector; generative AI is rapidly automating coding, customer support, and back-office functions. This shift creates a paradox for investors. On one hand, AI-enabled automation promises structural productivity improvements and the potential for higher-margin service offerings. On the other hand, rapid automation can compress labor-driven revenue streams in the near term if clients push for lower pricing or shorter project lifetimes as they extract value from automation alone.
Analysts have also flagged that even as AI unlocks new opportunities, it can accelerate the need for clients to re-evaluate vendor partnerships and the mix of services they buy. Accenture’s decision to trim the upper end of its annual revenue growth forecast re-ignited concerns about the pace of discretionary technology spending. In a market where large digital transformation contracts have historically supported robust growth, the pace and scale of AI adoption will influence both demand and pricing power. For Wipro, the question becomes whether AI-enabled offerings can offset the revenue headwinds from a cautious client base and a pro-cyclic IT spending cycle.
From a strategic standpoint, investors should monitor AI-enabled service lines, client concentration in core markets, and the mix between on-site, near-shore, and offshore delivery. The trajectory of AI-driven offerings could redefine profit margins as firms invest in new platforms and upskill staff to deliver high-value, repeatable solutions at scale. Meanwhile, the sector’s earnings narrative is evolving from growth-at-any-cost to value creation through automation, industry specialization, and recurring-revenue models. To navigate this transition, consider a data-driven approach–and if you want deeper analysis, Swastika's Sarthi AI stock assistant can help you compare Wipro with peers and gauge AI-related opportunities: Swastika's Sarthi AI stock assistant.
Analyst Revisions And Downgrades: What JPMorgan And Others Say
Market commentary around Wipro includes a blend of cautious tone and emphasis on fundamentals. One major brokerage downgraded Wipro to underweight and signaled that FY27 revenue growth estimates may be revised lower for Wipro and peer firms (including HCL Technologies and Tata Technologies). The latest narrative suggests that the sector could witness slower top-line growth in the next two years, with concerns around the pace of demand recovery in large digital transformation deals and a tougher expense environment across developed markets.
Practical Portfolio Moves For Retail Investors Amid IT Sector Volatility
Given the mixed signals, a pragmatic approach for retail investors is to maintain a well-structured watchlist and pursue risk-managed exposure to IT names. Start by anchoring decisions in a defined framework: identify your time horizon, assign a maximum tolerable loss, and set disciplined price alerts around the current wipro share price. Consider cross-checking ADR performance with NSE stock price context to get a layered read on global versus domestic demand dynamics. The CME FedWatch Tool indicates around a 67% probability of a September rate hike, with expectations of multiple rate increases through the year. Such macro cues tend to influence IT client budgets and the cost of capital for large deals, adding another layer to valuation and earnings risk for IT-focused equities.
Frequently Asked Questions
What happened to Wipro ADRs and how did it affect the Wipro share price?
Wipro ADRs plunged as much as 17% overnight, and the Wipro share price traded around Rs 170.35 in regular trading.
How has Wipro performed over the last 52 weeks?
Wipro is down about 54% from its October 14, 2021 record high of Rs 369.93.
What macro headwinds are affecting Indian IT stocks like Wipro?
North America is the biggest market for Indian IT services firms, and near-term macro headwinds there weigh on earnings visibility and demand.
What have major analysts said about Wipro's growth prospects?
Some analysts have downgraded Wipro to underweight and suggested FY27 revenue growth estimates could be revised lower, reflecting sector headwinds and caution on discretionary tech spending.
What macro-market signals should investors monitor in this environment?
Investors should monitor AI adoption signals, IT services demand in North America, and policy expectations such as rate-hike probabilities (e.g., CME FedWatch’s indication of a 67% chance of a September rate hike).
Conclusion
The Wipro share price movement around the ADR shock highlights a core truth for retail investors: AI-enabled disruption promises long-run upside, but near-term macro headwinds and policy shifts can keep the price under pressure. Valuations alone won’t tell the whole story; investors must weigh client exposure, deal mix, margin resilience, and the pace of AI adoption when assessing the risk-reward in IT equities. The prudent path is a disciplined framework: maintain a clear watchlist, set defined price targets, and stay ready to reallocate as earnings signals and AI-driven demand data unfold.
Latest Articles

Markets Near 24,000 Again: maruti suzuki share price Drives Nifty Momentum For Retail Investors


Key Takeaways
- Nifty opened 0.36% higher, crossing the 24,000 mark; Sensex joined above 77,000.
- Maruti Suzuki share price led gains as autos outperformed while IT remained the laggard.
- Persistent Systems stock crashed nearly 11% to a 52-week low amid Nagarro buyout concerns.
- Dow closed above 52,000; S&P 500 up 1.18%; Nasdaq surged past 2% on favorable global cues.
In a market where every tick matters, the maruti suzuki share price captured investor attention as Nifty opened higher by 0.36% and crossed the 24,000-mark. The Sensex followed suit, crossing the 77,000-level in today’s trade. This session also marks Nifty's weekly expiry and the close of the June quarter, a combination that has historically tested trader nerves and liquidity. The mood leaned on a mix of domestic cues and easing global tensions, helping to keep risk assets buoyant into the session.
As initial data streamed in, Nifty 50 traded up 0.36% to above 24,000, while Sensex gained 0.36% to hover around 77,000. In pre-market trades, Nifty 50 was at 24,057.30, up 0.50%, and Sensex stood at 77,076.05, up about 0.45%. The market’s footing remained tentative but constructive, with Maruti Suzuki share price taking a prominent spot on the gainers board as the autocycle led the rally amid a broader risk-on backdrop.
Monday’s session had seen a pullback: the Sensex fell 372 points and Nifty closed below 23,950, underscoring a consolidation phase that traders are trying to exit. Today’s mood was influenced by easing US-Iran tensions and the prospect of fresh Doha talks, which contributed to a firmer tone for risk assets as the week unfolds.
Maruti suzuki share price And Auto Sector Momentum: What It Signals For Retail Investors
The maruti suzuki share price moved higher as auto stocks outperformed, positioning the auto sector as a potential leader when risk appetite improves. This dynamic matters for retail investors because auto demand often serves as a proxy for consumer sentiment and rural/urban discretionary expenditure. While the IT sector lagged, autos demonstrated relative strength that can help cushion portfolios during choppier times. With technicals showing the 23,900–24,000 zone as a key support and 24,200–24,300 as resistance, the market’s next move could hinge on whether buyers sustain momentum beyond 24,000 and push toward the 24,300 mark, or whether sellers reassert around 24,200–24,300.
The day’s micro-structure also featured Waaree Energies dynamics: it opened at 0.48%, rose to 1.69% to trade around Rs 2,935, and then pulled back to Rs 2,885 by 9:35 am, illustrating intraday volatility that active traders should monitor. In the broader context, the persistent strength in autos contrasted with IT weakness, creating a case study in sector rotation that has become a recurring theme in this phase of the market.
On the macro front, the Dow Jones Industrial Average closed above 52,000 for the first time ever, with the S&P 500 up 1.18% and Nasdaq surging past 2%. Alphabet jumped nearly 5% on its debut as a Dow component (replacing Verizon); Tesla rallied 8.45%. The uplift in U.S. equities contributed to a global risk-on tone, aiding Indian markets in navigating the session’s local catalysts. The broader narrative remains the balancing act between valuation multiples and growth expectations, particularly as investors digest a mix of global liquidity conditions and domestic policy signals.
From a stock-specific lens, the persistent systems stock has been under pressure, crashing nearly 11% in the wake of Nagarro’s buyout deal, which brokerages flagged as pricey in the near term even as long-term rationale remains intact. The Nagarro deal is a reminder that large acquisitions can trigger short-term volatility even when the strategic logic is intact. The aurobindo pharma stock price action, in contrast, reflects company-specific news dynamics that can orient a stock differently from the broader IT or auto themes.
Infosys stock price Trends In The IT Sector: Evidence From The Session
The IT index persisted as the laggard this session, with the infosys stock price and the tcs stock price today moving in negative territory as all constituents traded red. The infosys stock price has retreated toward levels not seen since September 2020, while the tcs stock price today reflected continued softness despite the sector’s long-term growth prospects. The hcl tech stock price also touched multi-year lows, reinforcing the narrative of a structurally challenged IT space in the near term. These dynamics underline how broad market leadership can swing between cyclical and defensive pockets depending on macro and policy signals.
In this context, observing the eicher motors stock price becomes a useful contrarian indicator: Eicher Motors slid on concerns from Delhi’s EV policy 2.0, illustrating how policy risk can separate top-line narratives from micro-price action at the stock level. Meanwhile, the aurobindo pharma stock price movement sits more in line with sector momentum and healthcare-specific catalysts, illustrating the diversity of moves within the market’s breadth.
Tcs stock price today: IT Sector Momentum And Price Action
The day’s price action in the IT space keeps reminding investors that sector leadership can shift quickly. The tcs stock price today trend mirrored that of the broader IT segment: softness in large-cap IT names amid concerns over growth trajectories and margin pressure. The infosys stock price trajectory while weak, must be considered alongside other tech headlines, including new product cycles and potential foreign exchange influences that frequently drive near-term moves. For a retail investor, this means maintaining a balanced IT exposure while leveraging sectors like autos for potential upside when broader risk appetite returns.
Aurobindo pharma stock price And The US Market's Influence
The aurobindo pharma stock price action, in the meantime, benefits from company-specific drivers and a market environment that remains constructive on global risk appetite. The Dow’s run above 52,000, combined with a resilient S&P 500 and Nasdaq, offers a supportive backdrop for Indian pharma and healthcare names that often perform in line with global liquidity. Alphabet’s near-5% one-day surge on its Dow debut and a strong tech rally in the U.S. contribute to a global risk-on tone that can spill over to Indian equities as liquidity conditions remain conducive for cross-border investment activity.
Eicher motors stock price And The Delhi EV Policy 2.0 Impact
The eicher motors stock price moved lower by about 6.5% in response to the Delhi EV policy 2.0, highlighting the policy-sensitive nature of auto names with significant exposure to regulatory shifts. Royal Enfield’s product mix and export dynamics can influence the stock’s trajectory, even as the broader autos space exhibits resilience in certain market segments. This divergence between policy sensitivity and underlying demand underscores the need for careful stock-level due diligence and a robust risk framework for retail traders navigating sectoral winds.
Beyond individual stock stories, the market’s story includes the Vizhinjam Port deal: valued at $2.85 billion, TiL committing $1.4 billion for the stake, with $539 million paid toward initial acquisition of 49% and $858 million allocated for port expansion by December 2028. APSEZ will retain 51% and AVPPL remains a consolidated subsidiary of Adani Ports. Such megadeals show how infrastructure investment themes continue to influence sentiment, particularly for Indian logistics and port equities that stand to gain from expansion plans and regulatory clarity.
On the IPO front, Prism’s updated papers for a Rs 6,650 crore IPO reflect a mix of fresh issue and pre-IPO placement, with the proceeds earmarked to repay borrowings (Rs 4,987.5 crore to repay/prepay borrowings; a Rs 6,650 crore fresh issue and up to Rs 1,330 crore pre-IPO placement). These fund-raising dynamics remind retail investors that capital structure changes in high-growth areas can alter the risk-reward calculus for companies pursuing aggressive expansion strategies.
Frequently Asked Questions
What were the Nifty and Sensex levels near today's opening?
Nifty opened higher by 0.36% and crossed 24,000, with Nifty 50 at 24,057.30 in pre-market trade, up 0.50%. Sensex opened higher by 0.36% and crossed 77,000, with the index around 77,076.05 in pre-market trade.
Which stock led the gains on the Nifty today and what happened to IT?
Maruti Suzuki share price led the gains among Nifty constituents, while the IT sector remained the laggard with all major IT names in red and declines in large-cap names like infosys stock price and tcs stock price today.
What happened to Persistent Systems stock and why is Nagarro involved?
Persistent Systems stock crashed nearly 11% to a 52-week low after Nagarro's €1.27 billion buyout, which brokerages viewed as pricey in the near term even as they backed its long-term logic.
What are the key technical levels to watch for the next session?
The key support is in the 23,900–24,000 zone, with resistance in the 24,200–24,300 band. A breakout beyond 24,300 or a breakdown below 23,900 could set the next directional move.
What global cues supported the market today?
The Dow closed above 52,000 for the first time, with the S&P 500 up 1.18% and Nasdaq up over 2%. Alphabet jumped nearly 5% on its Dow debut, and Tesla rose 8.45%, while easing US-Iran tensions and Doha talks added to the risk-on mood.
What should retail investors do next, and how can Swastika help?
Retail investors should align with price levels around 23,900–24,000 for support and 24,200–24,300 for resistance, while watching sector leadership (autos vs IT). For deeper, AI-assisted stock analysis, Swastika's Sarthi can provide tailored insights aligned with your risk tolerance and horizon.
Conclusion
In a market where price action matters as much as headlines, retail investors should focus on the key levels that tend to govern next moves: keep a close watch on the 23,900–24,000 zone as a critical support and the 24,200–24,300 band as a resistance. The day’s dynamics suggest a bifurcated market where autos show leadership while IT lags, and global cues offer a tailwind that can sustain risk appetite if domestic catalysts align. The practical takeaway is to calibrate exposure to cyclicals when the price action confirms momentum, while maintaining risk discipline to navigate the consolidation that often precedes a more decisive move.
One actionable step for a retail investor is to set price-level alerts around the indicated zones and use a simple risk framework that caps position sizes during choppy sessions. For deeper, institution-level insights and tailored stock analysis–covering maruti suzuki share price and other key tickers–consider Swastika’s Sarthi AI stock assistant, a tool designed to translate complex market signals into practical decisions aligned with your investment horizon.
.jpg)
SBI Funds Management IPO: Complete Guide for Investors in 2026
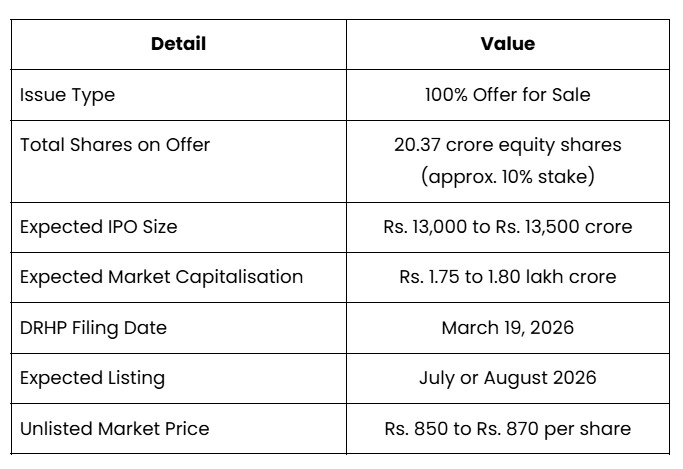
India's largest asset management company is heading to the public markets. SBI Funds Management Limited, the AMC behind SBI Mutual Fund, filed its Draft Red Herring Prospectus with SEBI on March 19, 2026. With an expected fundraise of Rs. 13,000 to Rs. 13,500 crore and a potential market capitalisation approaching Rs. 1.75 to 1.80 lakh crore, this is one of the most significant listings in India's financial services sector this year.
This guide covers everything an investor needs to know before applying, from how the IPO is structured and what the financials look like, to the risks the company itself has disclosed and the factors that will determine whether this IPO makes sense at the offer price.
About SBI Funds Management Company, and Why is This IPO Seeking Investors’ Attention?
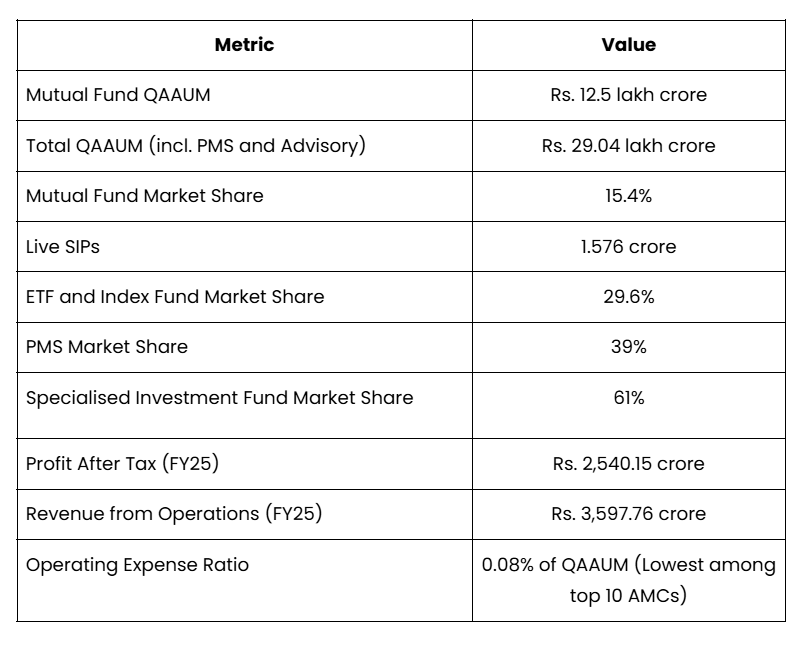
SBI Funds Management is India's largest asset management company, and it is not close. It manages a mutual fund quarterly average AUM of Rs. 12.5 lakh crore with a 15.4% market share as of December 31, 2025. When you include its institutional portfolio management and advisory books, total AUM reaches Rs. 29.04 lakh crore, making it one of the largest asset managers in Asia.
The company leads in two of India's fastest-growing investment categories simultaneously: actively managed mutual funds and passive products like ETFs and index funds. That dual dominance is rare, and it is a key reason this IPO is generating significant institutional and retail interest.
To understand the scale of what is being listed, here is a snapshot of where SBI Funds Management stands today across its key business metrics:
IPO Structure of SBI Funds Management: 100% Offer for Sale
The SBI Funds Management IPO is a 100% Offer for Sale. This is the most important structural fact investors must understand before applying. No new shares are being issued, and SBI Funds Management itself will not receive a single rupee from the IPO proceeds. All the money raised goes directly to the two selling shareholders. Before you apply, here are the core IPO details you need to have in front of you:
Who is Selling and at What Profit?
Understanding who is selling, how much they paid for their shares, and how much they stand to gain puts the IPO in its proper context. The numbers below tell an important story about where the value creation has already happened.
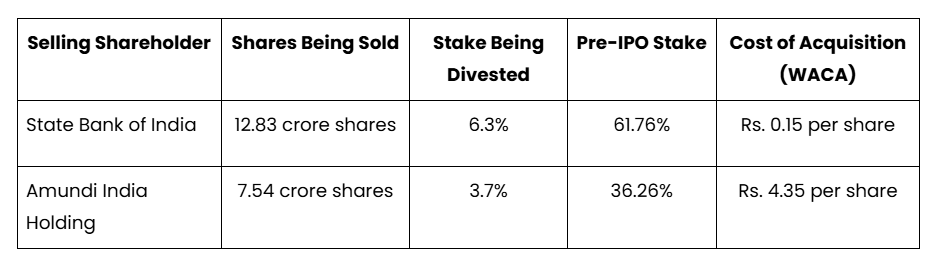
SBI acquired its stake at effectively Rs. 0.15 per share and Amundi at Rs. 4.35 per share. At an expected valuation of Rs. 1.75 to 1.80 lakh crore, both sellers are realising extraordinary returns on their original investments. IPO investors should assess honestly whether meaningful upside still remains after this re-rating has already occurred.
Revenue, Profit, and Dividends: How Has SBI Funds Management Performed Financially?
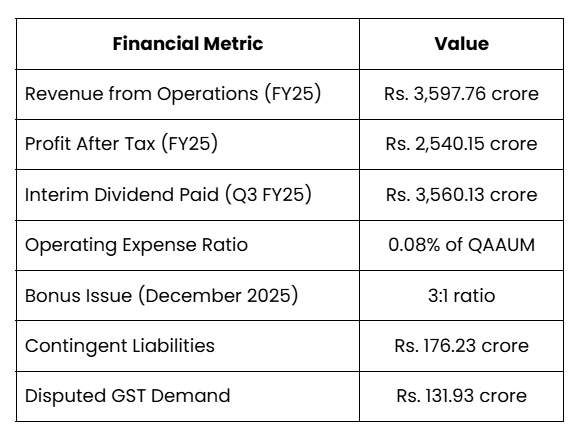
SBI Funds Management is a genuinely profitable and cash-rich business. It reported a profit after tax of Rs. 2,540.15 crore on revenue from operations of Rs. 3,597.76 crore for fiscal 2025. Its operating expense ratio of 0.08% of QAAUM is the lowest among India's top 10 AMCs, a direct result of the cost efficiency that comes with managing assets at this scale.
The dividend number is particularly telling. In just the third quarter of fiscal 2025, the company paid an interim dividend of Rs. 3,560.13 crore to its shareholders. A dividend larger than the full-year profit figure signals two things: the company carries significant retained earnings, and management is confident in the continuity of cash generation. In December 2025, the board also executed a 3:1 bonus share issue, tripling the share count, another signal of financial confidence.
The full financial picture, including contingent liabilities that investors should not overlook, is presented below:
According to CS Setty, Chairman of State Bank of India, speaking at the Citi India 2026 Conference, investors should stop watching daily market movements and start thinking about India as a long-term opportunity. He acknowledged that global geopolitical pressures have made markets choppy but urged investors not to lose sight of the bigger picture, describing India as one of the defining growth stories of this century that has moved well beyond the catch-up phase. 2.
What Makes SBI Funds Management Difficult to Compete With?
Distribution Through SBI Branches is an Unmatched Advantage
No AMC in India can replicate SBI Funds Management's distribution reach without the backing of a parent like State Bank of India. SBI operates 23,125 branches nationwide, covering urban centres, semi-urban towns, and rural areas that private sector banks and independent distributors rarely penetrate at comparable depth. Alongside this physical network, SBI's YONO digital platform serves over 96 million users, each of whom is a potential mutual fund investor already within the SBI ecosystem.
This is not a passive advantage. Every SBI account holder nudged toward an SIP through a branch visit, a teller recommendation, or a YONO notification adds to an AUM base that compounds over years. Building a comparable network from scratch would take decades and hundreds of thousands of crores. No private competitor can do it.
Amundi Provides the Investment Expertise Behind the Scenes
SBI brings distribution. Amundi brings investment depth. As Europe's largest asset manager, Amundi has embedded its risk management processes, investment frameworks, and product development capabilities into SBI Funds Management over a partnership spanning more than a decade. The stake now held by Amundi India Holding was originally held by Societe Generale S.A. before being transferred in June 2011, reflecting the long-standing and evolving nature of this international collaboration.
The SIP Book is One of the Stickiest in the Industry
SBI Funds Management runs 1.576 crore live SIPs. What makes this number particularly valuable is not its size but its staying power. The stickiness of this investor base is best captured by looking at how long those SIPs have remained active:
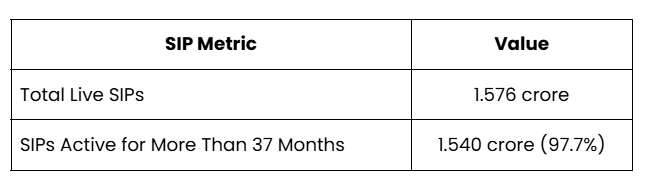
When 97.7% of SIP investors have stayed for more than three years without stopping their plan, it means they have already weathered market corrections and continued investing. For the AMC, this translates into a highly predictable monthly inflow of capital that grows AUM steadily regardless of short-term market sentiment. That predictability is itself a competitive advantage.
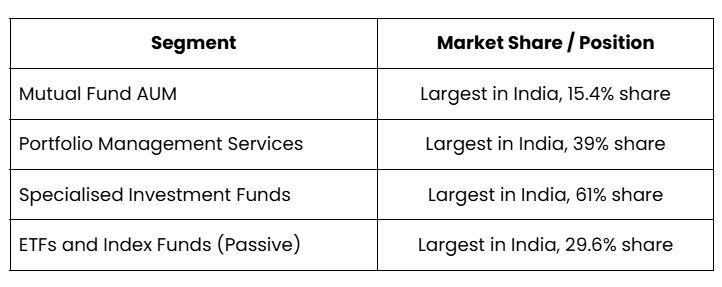
Leadership Across Multiple Business Segments
Most AMCs are dominant in one segment. SBI Funds Management holds the number one position across four separate business lines simultaneously. This breadth of leadership provides revenue diversification that most competitors simply do not have. The four segments and the company's standing in each are as follows:
A Research Engine That Supports Active Management
The company's investment decisions are supported by a research framework covering more than 400 listed companies and more than 200 fixed income issuers. This analytical infrastructure is a genuine entry barrier. Smaller AMCs operating at a fraction of SBIFM's scale simply cannot afford research teams of comparable depth, giving SBIFM a sustainable edge in active fund management quality.
Key Risks: What Has SBI Fund Management Disclosed in Its DRHP That Investors Must Read?
The DRHP for SBI Funds Management is candid about a substantial set of risks, and every investor should read them before applying. These are not hypothetical concerns invented by analysts. They are disclosures made by the company itself under regulatory obligation. Here is what the company has flagged and translated into what each risk actually means for you as a shareholder:
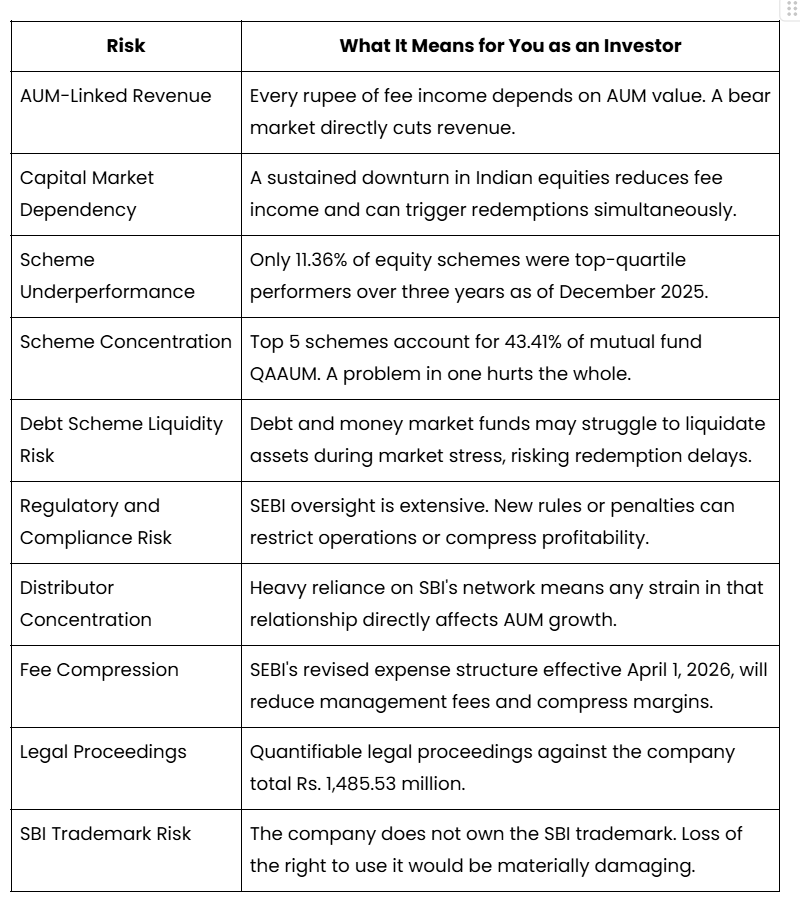
The trademark risk is worth pausing on because it has no easy fix. SBI Funds Management's brand identity, and a significant portion of its ability to attract and retain retail investors, is built around a name it does not legally own. The promoter relationship makes disruption unlikely, but the structural vulnerability is real and cannot be hedged away.
Peer Comparison: How Does SBIFM's Valuation Stack Up Against HDFC AMC and Nippon AMC?
Valuing the SBIFM IPO in isolation is difficult. The most practical approach is to benchmark it against its two closest listed peers, HDFC AMC and Nippon India AMC. This comparison reveals where SBIFM has a clear edge, where it falls short, and what those gaps mean for the multiple it should reasonably command.
The comparison below shows why SBIFM deserves a premium on AUM scale and cost efficiency, but why that premium may be partially offset by lower active equity performance and a compressed blended fee yield:
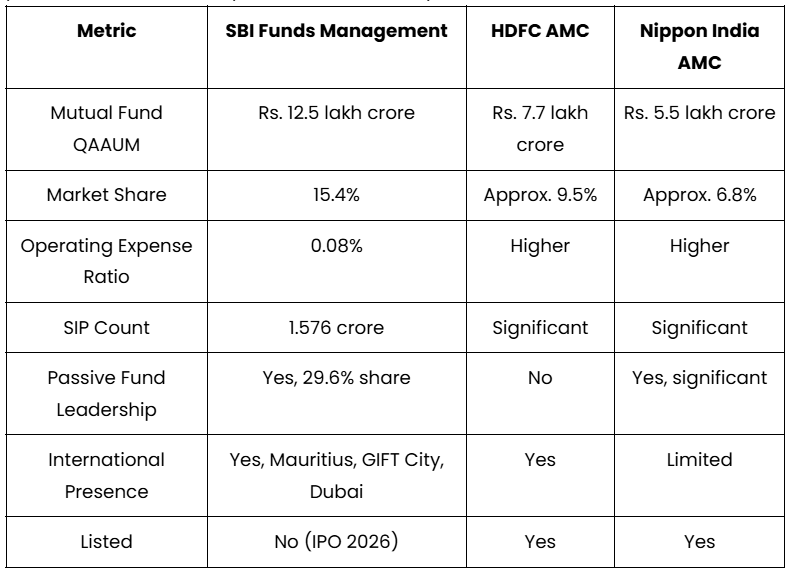
This comparison matters because HDFC AMC and Nippon India AMC are the reference points the market will use to price SBI Funds Management. SBI's AUM is significantly larger than both, and its cost efficiency is superior. However, its active equity performance metrics lag, and its blended fee yield is lower due to its heavy passive fund exposure. These factors will weigh on the valuation multiple relative to HDFC AMC's historical premium.
Pre-IPO Lock-In Rules: Can You Sell Your Unlisted Shares After Listing?
If you currently hold pre-IPO unlisted shares of SBI Funds Management, you cannot sell them immediately after the stock lists. SEBI's lock-in regulations determine when you are permitted to exit, and the rules differ depending on what category of investor you are and, in some cases, when you originally bought the shares.
The category-wise lock-in rules are straightforward, but the starting date of the lock-in period differs for institutional investors:
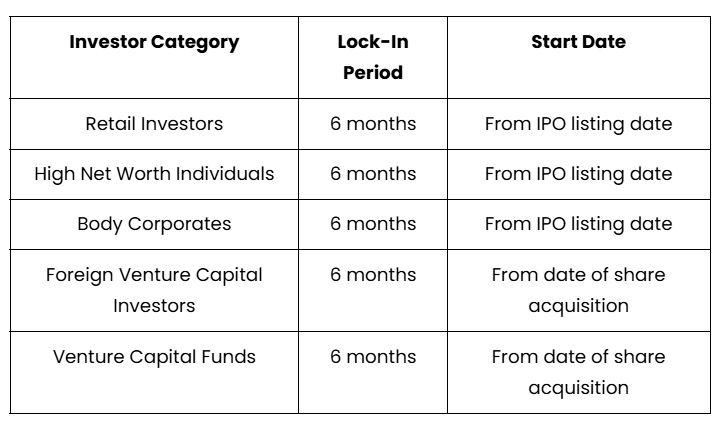
These rules follow SEBI's August 2021 regulatory amendments. With unlisted shares recently trading at Rs. 850 to Rs. 870 per share, investors holding pre-IPO stock should factor in this six-month restriction before making any assumptions about post-listing liquidity or exit timing.
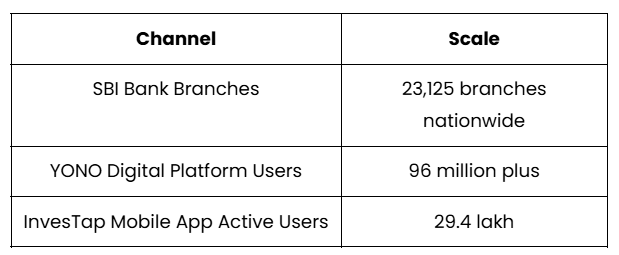
Domestic and Global Reach: How Does SBI Fund Management Distribute and Serve Investors?
Domestic Investor Touchpoints
SBIFM's domestic distribution infrastructure combines physical branch access through SBI with a growing digital presence through its own platforms. The scale of this network is what gives SBIFM a sustainable AUM mobilisation advantage that no standalone private AMC can replicate:
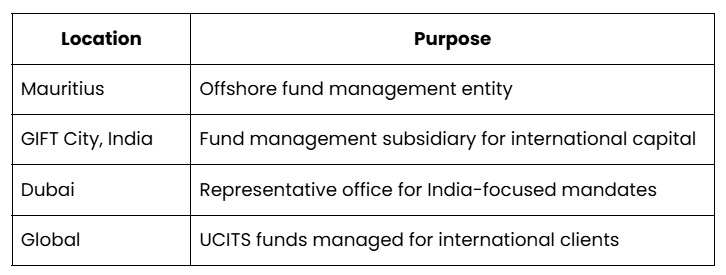
International Investor Access
Beyond India, SBIFM has built a multi-entity international structure to capture demand from global investors seeking India-focused investment products. Each entity serves a specific regulatory or investor purpose in its respective jurisdiction:
Should You Apply for the SBIFM IPO? The Bull Case and the Bear Case
The Bull Case: Why SBIFM Is Worth Owning for the Long Term
SBI Funds Management holds a market position that is structurally protected in ways that most businesses are not. Its SBI branch distribution network is irreplaceable. Its SIP book, with 97.7% of plans active for more than 37 months, delivers a recurring, compounding inflow of capital that cushions revenue even in difficult markets. Its simultaneous leadership across mutual funds, PMS, specialised investment funds, and passive products provides genuine revenue diversification.
For investors who believe in India's long-term financialisation story, SBIFM is one of the most direct and defensible ways to participate. Every new SIP started, every mutual fund account opened, and every ETF unit purchased through its channels strengthens the AUM base that drives fee income. The tailwind is structural and multi-decade in nature.
The Bear Case: What Could Disappoint Investors Post-Listing
The active equity performance gap is the most immediate concern. With only 11.36% of equity schemes in the top performance quartile over three years, SBIFM is not consistently winning on the dimension that matters most to active fund investors. In a maturing market where investors increasingly compare performance data before choosing an AMC, this could pressure active equity AUM retention over time.
SEBI's fee compression effective April 2026 is already confirmed and will reduce management fees across the industry. Given SBIFM's already significant exposure to low-fee passive products, its blended fee yield will come under further pressure even as total AUM continues to grow. Revenue growth will lag AUM growth, and margin expansion will be harder to achieve than historical trends suggest.
Finally, the pure OFS structure means that at the IPO price of Rs. 850 to Rs. 870 in the unlisted market, you are buying at a valuation where both promoters, who acquired shares at Rs. 0.15 and Rs. 4.35 respectively, have already realised the bulk of the value creation. The upside from here depends entirely on future earnings growth and multiple expansion, not on any post-IPO transformation of the business.
Final Verdict: Is the SBIFM IPO a Buy, Hold Off, or Avoid?
SBI Funds Management is a rare business. It is profitable, cash-rich, debt-free, and sits at the centre of India's growing mutual fund industry. The fundamentals are hard to argue with. The only real debate is whether the IPO price leaves enough room for the next investor to make a meaningful return.
If the price band is set reasonably, this is a quality business worth holding for the long term. If it comes at a premium that already prices in years of future growth, patience may serve you better than enthusiasm on listing day.
Either way, this is not a straightforward IPO to evaluate on your own. The OFS structure, SEBI's new fee regulations, the trademark dependency, and the active fund performance gap all carry different implications depending on where you stand financially. What makes sense for one investor may not make sense for another.
That is exactly where a conversation with an expert helps. Swastika Investmart's research team has been closely following the SBI Fund Management IPO since its DRHP filing and can walk you through the valuation, the risks, and the right entry strategy based on your specific goals and portfolio.
Reach out to Swastika Investmart before the subscription window opens. A ten-minute conversation could make a meaningful difference to the decision you take.
Frequently Asked Questions About SBI Fund Management IPO
What is the SBI Funds Management IPO date?
The SBI Funds Management IPO is expected to open for subscription in July or August 2026. The DRHP was filed with SEBI on March 19, 2026, and the listing is targeted for the same calendar year.
What is the price band of the SBI Funds Management IPO?
The official price band for the SBI Funds Management IPO has not yet been announced. Based on unlisted market activity, shares have recently traded between Rs. 850 and Rs. 870, though the IPO price band may be set at a discount to these levels.
What is the GMP of the SBI Funds Management IPO?
Unlisted shares of SBI Funds Management have recently traded between Rs. 850 and Rs. 870 in the grey market, reflecting strong investor interest ahead of the official listing.
What is the issue size and valuation of the SBI Funds Management IPO?
The SBI Funds Management IPO is expected to raise between Rs. 13,000 and Rs. 13,500 crore through a 100% Offer for Sale of approximately 20.37 crore equity shares. The implied market capitalisation is estimated at Rs. 1.75 to 1.80 lakh crore based on current unlisted market prices.
Is the SBI Funds Management IPO a fresh issue or an OFS?
The SBI Funds Management IPO is a 100% Offer for Sale. No new shares are being created, and the company itself will not receive any proceeds from the listing. All funds raised go directly to the selling shareholders, State Bank of India and Amundi India Holding.
Should I invest in the SBI Funds Management IPO?
SBI Funds Management is a fundamentally strong business with consistent profitability, a debt-free balance sheet, and dominant market positions across mutual funds, PMS, and passive funds. Whether the IPO is right for you depends on the final price band, your investment horizon, and your personal financial goals. Consult a SEBI-registered financial advisor before applying.
What are the allotment and listing dates for the SBI Funds Management IPO?
The official allotment and listing dates have not yet been announced. The IPO is expected to list in July or August 2026. Check the Swastika Investmart website for updates as the listing timeline is confirmed.

Kec International Limited Share Price Surges on Rs 1,754 Crore Orders Across T&D and Cables
Key Takeaways
- Rs 1,754 crore orders across T&D and Cables lift near-term visibility.
- Largest-ever tower order from the USA expands global footprint in T&D.
- YTD order intake crosses Rs 4,000 crore, improving revenue visibility.
- Q4 FY2026 profit falls 28.11% YoY to Rs 192.79 crore; revenue down 7.01% to Rs 6,389.75 crore; price action around Rs 539.15 and 4.63% uptick.
KEC International Limited's stock moved higher as fresh order wins spark renewed interest in its growth path. The kec international limited share price ticked higher after the company bagged Rs 1,754 crore in new orders across Transmission & Distribution (T&D) and Cables & Conductors, including the largest-ever tower order from the United States. This signal of momentum comes as YTD order intake crosses Rs 4,000 crore, signaling improved revenue visibility in the coming quarters.
For retail investors tracking Indian infrastructure players, the story is less about a single quarter and more about a rising order book that could translate into higher execution activity in 2026-27 and beyond. KEC International operates across multiple verticals–Power Transmission & Distribution, Civil, Transportation, Renewables, Oil & Gas pipelines, and Cables–providing a diversified exposure to varied infrastructure cycles. The latest win highlights the company's strength in the tower supply business, a core lever for revenue and margin recognition in the long cycle of EPC projects.
Kec international limited share price reaction to Rs 1,754 crore orders in T&D and Cables
The market interpretation of these orders is that KEC's execution structure and project management capabilities are aligned to capture larger deals, particularly in the Americas. The Transmission & Distribution towers segment has historically been a major portion of the order mix, and this latest order underscores the robustness of demand in the American T&D market. In the near term, investors will watch for how quickly the company can convert these orders into revenue and how margins hold up across the larger project pipeline. The new wins also reflect ongoing diversification away from a region-heavy mix toward a more balanced global footprint.
Vimal Kejriwal, MD & CEO, emphasised the strategic importance of the tower business, noting that repeat orders from customers in the Americas, including the US, signal momentum in this market. With these orders, the YTD order intake stands at over Rs 4,000 crore. This contextual backdrop matters because a growing order book is typically a precursor to revenue visibility and potential margin leverage, especially for a capital-intensive, EPC player like KEC International.
How the Rs 1,754 crore orders impact kec international orders backlog and revenue visibility
Beyond the headline number, the deal mix underlines a few practical implications. The total order backlog is extended, and there is renewed optimism around the conversion of orders into revenue in the quarters ahead. The company has a multi-vertical footprint across T&D, Cables, and other infrastructure EPC segments, which can provide revenue diversification during global capex cycles. The new orders align with the company’s stated strategic focus on strengthening its tower sales business globally, which should bolster the consistency of cash flows in the medium term.
In terms of geography, the United States remains a critical growth market for towers–a sector where KEC International has been steadily expanding its presence. The combination of domestic and international projects across the T&D and cable segments reduces reliance on any single region, providing a more resilient order book. The immediate takeaway for investors is that a stronger order book can translate into better revenue visibility and potentially higher execution efficiency as KEC scales up its tower supply operations.
Kec international quarterly results: dissecting Q4 FY2026 performance vs orders
Turning to the quarterly numbers, KEC International reported a consolidated net profit of Rs 192.79 crore for the quarter ended 31 March 2026, down 28.11% from Rs 268.19 crore in the corresponding quarter last year. Revenue from operations declined 7.01% year-on-year to Rs 6,389.75 crore. The results reflect the ongoing pressures from project mix and execution cycles even as the company benefits from order wins across its T&D and cables verticals. The juxtaposition of rising order intake with softer quarterly profits highlights the risk-reward balance for investors: execution pulse can improve with a larger backlog, but near-term profitability may be pressured by project mix, commodity costs, and currency movements.
From a valuation perspective, the stock price action around Rs 539.15 reflects a positive near-term mood on the order wins, though investors must weigh the longer cycle nature of EPC projects and potential margin volatility. The company’s presence across international markets, coupled with the existing order book, suggests that revenue visibility could improve over the next few quarters if execution stays on track and capital expenditure cycles globally stabilize.
Current kec international stock price and momentum: what retail investors should watch
As of now, the stock price stands around Rs 539.15, with the day showing a 4.63% rise. Price momentum is likely to be influenced by the pace at which new orders translate into revenue and the company’s ability to manage margins amidst the inflationary environment and currency headwinds. For retail investors, the key questions are: how sustainable is this momentum beyond a single set of orders, and what is the trajectory for the order book over the next two to four quarters? In this context, tracking the quarterly results and the management’s commentary on cost control and margin protection will be important. From a risk perspective, execution delays and client concentration in certain geographies could temper upside if not managed well. In the interim, a more diversified project pipeline can help cushion potential volatility in the short run.
For those seeking deeper, institutional-level research on KEC International, Swastika's Sarthi AI stock assistant can help you compare the company’s order book growth, segment mix, and market-specific opportunities across geographies. This tool can be a practical complement to traditional disclosures, particularly for retail investors evaluating long-term growth trajectories.
Geographic and segment mix: Americas growth boosts T&D and Cables across markets
The company’s footprint spans power transmission & distribution, civil, transportation, renewables, oil & gas pipelines, and cables. The latest orders reinforce a broader strategy of expanding the tower sales business globally, especially in the Americas, while continuing to win cables and other EPC projects in India and international markets. The USA’s demand for high-voltage transmission infrastructure aligns well with KEC International’s capability to supply towers and related components to major utilities and developers. In India, domestic infrastructure spending, including power transmission expansion, remains a meaningful growth anchor, while the presence in renewables and oil & gas projects adds optionality in the longer term.
From an investment perspective, observers will be watching for how the company manages working capital and project execution across its diversified project portfolio. The margin profile across T&D towers and cables may diverge, given the different capital intensity and supply chain considerations. Yet, the broad-based footprint reduces geographic risk, and a solid order book provides a cushion against a softer quarter here or there. Investors should also track macro factors such as currency movements, commodity prices, and interest rates, which can influence project costs and profitability.
Frequently Asked Questions
What is the Rs 1,754 crore order and which segments does it cover?
The Rs 1,754 crore order wins span Transmission & Distribution (T&D) and Cables & Conductors, including a large tower supply order in the United States, marking a significant uplift in the company's order book.
What is the YTD order intake for KEC International?
The year-to-date order intake stands at over Rs 4,000 crore, signaling momentum in the company’s global T&D and cables businesses.
What were KEC International's Q4 FY2026 results?
In the quarter ended 31 March 2026, the consolidated net profit declined 28.11% year-on-year to Rs 192.79 crore, while revenue from operations fell 7.01% to Rs 6,389.75 crore.
What is the current kec international stock price and its movement?
The current price is Rs 539.15, with the stock moving up about 4.63% on the day.
What is the strategic significance of the US tower order for KEC International?
The largest-ever tower order from the USA underscores momentum in the American T&D market and strengthens KEC's global tower sales strategy, potentially enhancing revenue visibility and diversification.
Conclusion
In the near term, KEC International’s Rs 1,754 crore order win across T&D and Cables strengthens revenue visibility and signals a strategic shift toward a more diversified, global tower sales footprint. The resulting movement in the kec international share price reflects investor optimism about the company’s ability to monetize a growing order book, particularly in the Americas. However, the quarter ended 31 March 2026 showed a profit decline, underscoring the caution investors must exercise regarding margin trajectory and execution risk as projects scale up.

Vinit Mobile Limited IPO: Should You Apply, Wait for Listing, or Skip?
Key Takeaways
- Open window: 30 Jun to 2 Jul 2026, price band ₹150-₹158, lot size 800, NSE SME.
- GMP data not available yet, leaving near-term demand signals unclear.
- Key risks: SME exposure, and unknown OFS/registrar/lead manager info.
- Action: assess risk tolerance and decide to apply, watchlist, or avoid based on your post-listing plan.
IPO details: price band, lot size, issue size, open/close dates, listing date
Subscription & GMP signals
GMP data is not available yet, so the immediate premium or discount signal remains unknown. The official quota split is QIB 21,600; NII 2,73,600; Retail 12,09,600, indicating the bulk of demand would come from retail investors, but actual subscription will determine final allotment.
Valuation: is the ₹150-₹158 band justified?
Given the SME context and the lack of detailed business disclosures in the source, it is difficult to judge a fair multiple or earnings-based valuation. The price band sits within the SME norm, but the absence of promoter background, revenue/EBITDA figures, and competitive positioning makes it a high-uncertainty call for risk-averse retail investors.
Risks to consider
- Limited business visibility and SME-level disclosure.
- OFS details and the registrar/lead manager information are not announced yet, creating governance opacity.
- GMP data unavailable; subscription response unknown; final allotment depends on demand.
- Fresh-issue-only structure means concentration of capital into a single issuer, with no secondary offering.
How to apply for Vinit Mobile Limited IPO via UPI/ASBA
To participate, bidders typically use the ASBA process through their bank or broker, or UPI-based bidding via their trading app. Enter the bid price within ₹150-₹158, specify the lot size of 800 shares, and complete the payment via ASBA or UPI. After bidding closes on 2 Jul 2026, you will receive bid confirmation and allocation details after the final allotment. Retail investors can apply through Swastika before the issue closes on 2 Jul 2026, to have an easier path to track this SME opportunity.
Allotment & listing timeline
Open: 30 Jun 2026; Close: 2 Jul 2026; Listing: 7 Jul 2026 on NSE SME. Allotment status, which determines whether you win stock, will be announced after the bid period closes.
FAQ
Is Vinit Mobile Limited IPO worth applying for at ₹150-₹158?
Given the limited business visibility and no GMP data yet, the decision depends on your risk tolerance and post-listing plans.
When does the Vinit Mobile Limited IPO open and list?
Open 30 Jun 2026; Close 2 Jul 2026; Listing on 7 Jul 2026.
Is there GMP data available for this IPO?
No GMP data is available yet.
What are the allotment odds or quotas for investors?
Retail quota is 12,09,600; NII 2,73,600; QIB 21,600; final allotment depends on demand and bidding outcomes.
What are the main risks of this SME IPO?
Limited business details, governance clarity gaps (registrar/lead manager not announced), and no GMP data increase post-listing uncertainty.
Conclusion
Vinit Mobile Limited IPO is a small-ticket SME offer with limited business visibility and no GMP signal yet. For most retail investors, this translates to a high-risk, low-visibility bet that warrants caution and a post-listing plan. Watchlist this SME IPO and decide after listing.
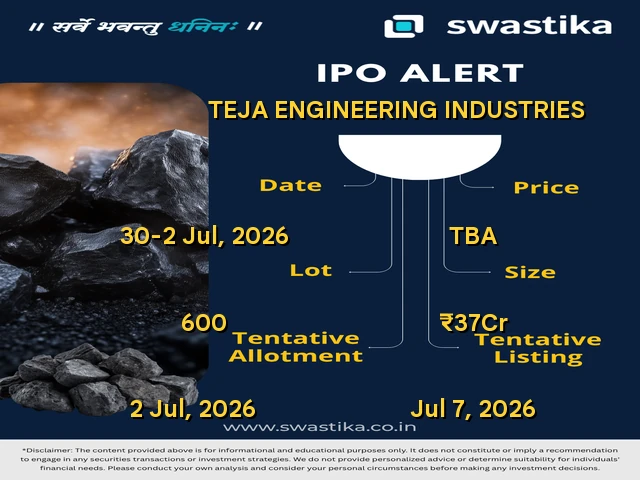
Teja Engineering Industries IPO: Should You Apply, Avoid, or Wait for Listing Gains?
Key Takeaways
- Teja Engineering Industries Ltd SME IPO opens 30 Jun 2026 at ₹220 fixed price for 16,98,000 equity shares (₹37 crore) with a 600-share lot.
- Fresh issue is ₹35 crore; NSE SME listing on 7 Jul 2026; NII 8,06,400 and Retail 8,06,400 quotas.
- GMP not available yet; no live subscription data; registrar/lead manager details are To Be Announced.
- Minimum investment is ₹1.32 lakh (600 shares x ₹220); assess risks, and decide to apply, watchlist, or avoid.
Teja Engineering Industries IPO details: fixed price, dates, and size
The Teja Engineering Industries SME IPO is a fixed-price offer of 16,98,000 equity shares of face value ₹10, aggregating up to ₹37 crore. The fresh issue portion is 16,12,800 shares (up to ₹35 crore). The shares are proposed to be listed on NSE SME. The lot size is 600 shares, and the minimum order quantity is 600 shares. The opening date is 30 June 2026 and the closing date is 2 July 2026; the listing is slated for 7 July 2026. The registrar is Kfin Technologies Ltd, while the Lead Manager and other key details are To Be Announced. The face value per share is ₹10. The price is ₹220 per share. Fresh issue is ₹35 crore and the total issue size is ₹37 crore.
The GMP signal and live subscription data are not available yet; investors should monitor market chatter and disclosures as the close date approaches. The fixed price of ₹220 and the small base issue size mean price discovery will depend heavily on demand for a micro-cap company with limited publicly disclosed financials.
Teja Engineering Industries IPO valuation: is the ₹220 price justified?
With a fixed price of ₹220 for 16,98,000 shares, the implied market cap at listing would be around ₹37 crore. Without published revenue, profit, or margins in the source material, it is difficult to judge earnings multiples. The SME segment often carries higher risk given limited financial visibility, concentration risk for customers/suppliers, and a shorter track record. Compare this to peers in the SME space only if you know their margins and growth; in this case, the absence of crisp financials makes valuation ambiguous and therefore higher risk relative to a stock with a transparent earnings history.
Should you apply? Pros and cons
- Pros: Fixed price provides clarity on the cost of entry; 600-share lot keeps minimum investment relatively high but predictable (₹1.32 lakh at ₹220); NSE SME listing provides potential for listing gains if demand exists; The fresh funds imply company expansion or working capital enhancements.
- Cons: No GMP signal yet, limited financial data, tight lot size, and SME risk with market demand uncertainty; Quota information for QIB is to be announced, which clouds demand depth; The registrar and lead manager are yet to be announced, adding execution uncertainty.
In practice, risk-tolerant retail investors who can commit around ₹1.32 lakh or more and who want to bet on early-stage manufacturing demand could consider applying, but most investors should weigh the lack of financial visibility and the absence of GMP signals before bidding. For many, it may be prudent to wait for the listing and observe price action and demand patterns before increasing exposure.
How to apply via UPI/ASBA for Teja Engineering Industries IPO
Applying to an SME fixed-price IPO typically involves submitting bids through your broker's IPO interface and choosing a payment/participation method such as UPI or ASBA. Here is a basic guide you can adapt to your broker’s platform:
- Log in to your trading/apply platform and navigate to the IPO section for Teja Engineering Industries Ltd.
- Enter the bid quantity in multiples of the fixed lot (600 shares). The minimum bid is 600 shares.
- Choose the price as ₹220 per share (fixed price).
- Select payment method: UPI or ASBA (Application Supported by Blocked Amount) via your bank or broker’s interface.
- Confirm and place your bid before the close date (2 July 2026).
- After bidding, monitor allotment status on the registrar/stock exchange portals and check the final allotment on the specified date.
Using a platform that supports IPO applications can simplify the process, but ensure you have funds available and understand that ASBA funds are blocked until allotment is announced.
FAQ
Is Teja Engineering Industries IPO worth applying for at ₹220 fixed price?
Given the fixed ₹220 price and the lack of published revenue/profit data in the source material, the investment case hinges on a growth story that is not clearly documented; SME listings carry higher risk and thus demand careful price and risk assessment before bidding.
What is the minimum investment for this IPO?
The lot size is 600 shares, so the minimum theoretical investment at ₹220 per share is ₹1,32,000. The official “Minimum Investment” is To Be Announced, so use the lot size as your working reference for now.
When is the Teja Engineering Industries IPO listing date, and how is the allotment done?
The listing is scheduled for 7 July 2026 after opening 30 June and closing 2 July 2026. Allotment results are typically published a few days after the bid close; exact days will be released by the registrar once the process completes.
What is the GMP signal for this IPO?
GMP data is not available yet, which means there is no current market-gauged listing premium or discount to rely on; this increases the risk of the listing day move being uncertain.
How can I bid via UPI/ASBA for Teja Engineering Industries?
Use your broker’s IPO bid flow to place a fixed-price bid at ₹220 per share, select UPI for payment or ASBA to block funds, and submit before the close date; check allotment status on the exchange or registrar portals once allotted.
Conclusion
Teja Engineering Industries’ SME IPO is a small-ticket, fixed-price offering with limited disclosed financials and no GMP signal, making it a higher-risk bet for most retail investors. The lack of a clear earnings history and the uncertainty around demand imply you should treat this as a high-risk, watchlist candidate rather than a core portfolio buy. Watch the listing day to gauge actual demand and price action, and only bid if you have defined risk tolerance and capital ready for potential volatility. Watchlist – because the fixed price and the absence of GMP signals mean the listing outcome is uncertain and further data could dramatically shift risk-reward dynamics.

Rashi Peripherals share price: AI-Driven Growth In India's ICT Distributor
Key Takeaways
- The rashi peripherals share price surged 112% YTD and 157% over the past year on AI-led enterprise IT demand.
- FY26 revenue rose 14.9% to Rs 15,827 crore; EBITDA was Rs 459 crore and net profit Rs 282 crore, with margins improving.
- EBITDA margin at 2.9% and ROCE of 16% signal operating leverage as pricing stays firm and revenue grows.
- A Rs 20,000-25,000 crore pipeline, a Rs 2,000 crore Yotta project, and partnerships with Dell, Teachmint, and Oura point to a robust long-term growth trajectory.
In 2026, the rashi peripherals share price story stands out for its velocity and breadth. The stock has surged 112% year-to-date and 157% over the past year, a momentum that mirrors India’s AI-led enterprise IT shift. Behind the price are FY26 numbers: revenue Rs 15,827 crore, EBITDA Rs 459 crore, net profit Rs 282 crore, ROCE 16%, ROE 15%, with margins improving as pricing firmed. The company is expanding into semiconductors and commercial IT distribution, while branch counts rose to 55 across 700 towns. The question for investors is: can this growth sustain as consumer demand shows hints of weakness in FY27?
What The rashi peripherals share price Signals About AI-Driven Growth Across India's ICT Distribution
The signal from the rashi peripherals share price is not just momentum; it reflects the core growth thesis: AI adoption in India is expanding enterprise IT budgets, and the distributor is positioned to capture that spend through a broadened product mix and a widening enterprise footprint. FY26 revenue of Rs 15,827 crore included 58% from Personal Computing and Enterprise Solutions, with the remaining 42% from Lifestyle and IT Essentials. This mix shift, combined with pricing leverage from higher-value products, supported margins as described in the FY26 results. The company notes semiconductors as the fastest-growing segment, with 131% year-on-year growth, underscoring how AI and data centers are shifting margin profiles higher in select lines. The Dell Technologies partnership for commercial IT distribution is expected to contribute a double-digit share of revenue next year, a key factor for investors to monitor.
Rashi Peripherals Stock Performance And FY26 Snapshot
The stock performance aligns with the earnings trajectory. The company posted year-on-year revenue growth of 14.9% in FY26, with a revenue line of Rs 15,827 crore and EBITDA of Rs 459 crore. Net profit stood at Rs 282 crore, while operating cash flow was Rs 114 crore. EBITDA margin rose to 2.9% in FY26, and net profit margin also improved from the prior year. ROCE is 16% and ROE is 15%, reflecting efficient capital use. The current share price sits at Rs 761, with a valuation multiple of 18x earnings. The branch network expanded to 55, serving more than 700 towns, and the company remains active in international markets through its India and Singapore subsidiaries.
AI Adoption, Data Centre Investments, And Enterprise IT Spend: Growth Drivers In 2026-27
India’s AI adoption trajectory is a strong tailwind for players like Rashi Peripherals. Enterprise PC replacement cycles are accelerating as organizations modernize, while data center investments continue to expand the demand for servers, storage, and AI-enabled solutions. The FY26 metrics illustrate this thesis: Personal Computing and Enterprise Solutions accounted for 58% of revenue, with 42% from Lifestyle and IT Essentials. A 131% YoY growth in the semiconductor segment points to higher-margin opportunities beyond traditional distribution. The company also highlights a growing enterprise tech spend and the potential for pricing power to sustain operating leverage. In addition, a Rs 2,000 crore Yotta project completed in 2025 involved 512 servers and 4,000 GPUs, signaling capacity to absorb AI workloads. Pipeline opportunities worth Rs 20,000-25,000 crore suggest this momentum could extend well into the next few years. The Dell partnership is expected to contribute a double-digit revenue share next year, further reinforcing the growth thesis. Swastika’s Sarthi AI stock assistant can help you model these scenarios with institutional-grade rigor.
Partnerships And New Ventures: How Dell, Teachmint, And Oura Are Shaping Margins
Strategic collaborations are a key pillar of the growth story. Dell Technologies has partnered with Rashi Peripherals for commercial IT distribution, providing a channel to scale enterprise-level hardware and services in a market where data sovereignty and security are increasingly prioritized. Teachmint Technologies has linked with the company to deploy AI-based education products, expanding the consumer and education technology footprint beyond traditional peripherals. In addition, the launch of Oura health rings in India demonstrates a diversification into wearable tech and wellness devices, broadening the consumer product portfolio. On the margin side, the semiconductor business and AI-focused initiatives tend to generate higher margins than standard distribution. Margins could continue to expand if pricing remains firm and the revenue trajectory holds, especially with the supportive tailwinds from enterprise AI demand and data center investments.
Risks, Valuation, And Investment Strategy For The Stock
Investors should weigh several risks alongside the growth thesis. Slower consumer demand and weaker PC shipments could temper near-term revenue, and slow-moving inventory or declines in memory prices could pressure margins. The company has acknowledged these risks, even as the FY26 EBITDA margin rose to 2.9% and net profit margin also improved. The stock’s current price is Rs 761 per share, with a valuation of about 18x earnings, which implies favorable but not excessive risk-adjusted upside given the growth pipeline. The expansion into semiconductors and commercial IT distribution strengthens the long-term earnings trajectory, but investors should monitor consumer demand dynamics in FY27 and beyond. The 55-branch network and reach across 700+ towns provide a broad distribution moat that could help cushion cyclical headwinds.
Frequently Asked Questions
What were Rashi Peripherals' FY26 revenue, EBITDA, and net profit?
FY26 revenue was Rs 15,827 crore, EBITDA was Rs 459 crore, and net profit was Rs 282 crore. The company posted a 14.9% YoY revenue growth, with ROCE at 16% and ROE at 15%.
How did the rashi peripherals share price perform in 2026?
The rashi peripherals share price rose 112% year-to-date in 2026 and had surged 157% over the past year, reflecting AI-led demand and expanding enterprise IT investments.
What are the key growth drivers for Rashi Peripherals in 2026-27?
Key growth drivers include AI adoption in India, the enterprise PC replacement cycle, expanding data center investments, and rising enterprise technology spending. The company also notes a fast-growing semiconductor segment (131% YoY) and a robust pipeline of opportunities (Rs 20,000-25,000 crore).
What is the size of the pipeline opportunities and the Yotta project?
Pipeline opportunities are worth Rs 20,000-25,000 crore, signaling strong demand for enterprise AI and data sovereignty projects. The Yotta project, completed in 2025, involved Rs 2,000 crore and included 512 servers and 4,000 GPUs.
What is the current share price and the stock's valuation multiple?
The current share price is Rs 761 per share, and the stock trades at about 18x earnings.
Conclusion
Rashi Peripherals has delivered strong FY26 growth, supported by rising AI adoption, enterprise IT spending, and strategic partnerships. While near-term risks such as softer consumer demand remain, its expanding semiconductor business, robust project pipeline, and improving profitability position the company well for sustained long-term growth.
Big Budget


Popular Articles


.avif)
.avif)

.avif)


START YOUR INVESTMENT JOURNEY
Get personalized advice from our experts
- Dedicated RM Support
- Smooth and Fast Trading App
