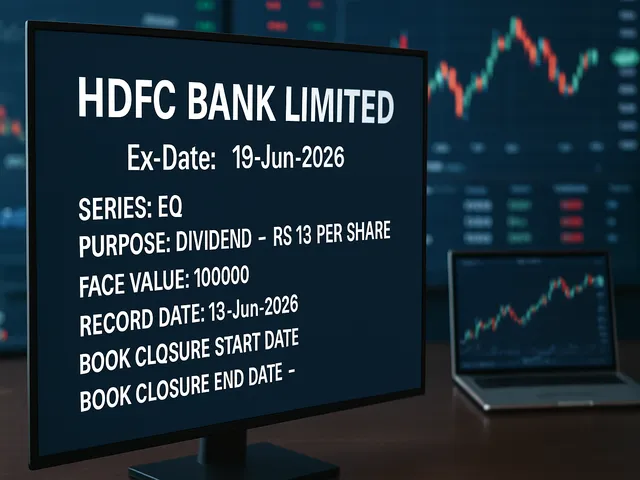
HDFC Bank Limited - Ex-Date: 19-Jun-2026


Quick Takeaways
• HDFC Bank announces a Rs 13 per share dividend for the EQ series with ex-date and record date on 19-Jun-2026.
• Ex-date explains eligibility: ownership before 19-Jun-2026 qualifies for the payout.
• Dividend yield depends on the stock price and may affect short-term price movements around the ex-date.
• Book closure dates aren’t specified in the notice; verify timings through official filings and exchanges.
HDFC Bank Dividend Alert: Rs 13 Per Share Ex-Date 19-Jun-2026
Overview of the announcement
HDFC Bank has announced a dividend on its equity shares for the series EQ, with a payout of Rs 13 per share. The ex-date and the record date are both set for 19 June 2026. The notice lists the face value as Rs 100,000 per share, a nominal value used in regulatory filings. No book-closure dates are specified in the notice, so investors should verify the final dates with the exchange or the bank's investor relations portal. This dividend reflects the bank's ongoing practice of returning capital to shareholders at regular intervals, a common feature among large Indian lenders.
What ex-date means and why it matters
Ex-date is the key cutoff for eligibility. If you buy shares on or after the ex-date, you will not receive the declared dividend for this cycle. Those who hold shares before the ex-date qualify for the payout, subject to being registered as a shareholder on the record date. On or around the ex-date, the stock price often adjusts downward to reflect the impending dividend, though market moves can overshadow this adjustment. The record date confirms who is entitled to receive the dividend, and in this case it is 19 June 2026. For investors, understanding these dates helps avoid missing out on expected income and ensures correct settlement timing across brokers and exchanges.
Dividend yield and portfolio impact
The Rs 13 per-share dividend provides a clear income component, but the realized benefit depends on the share price at the ex-date. Yield is calculated as annual dividend divided by the market price, so higher prices reduce the percentage yield and lower prices increase it, all else equal. Remember that total return includes price movement and taxes, not just the dividend amount. This means a stock could deliver a modest dividend but strong price appreciation, or vice versa, influencing overall performance. For those comparing dividend opportunities, it helps to look at historical payout consistency and the longer-term trend in the stock's returns rather than a single payout event.
Yield calculation basics
As a simple illustration, if a share trades around Rs 6,000 and pays Rs 13 in annualized dividend, the nominal yield from this payout is about 0.22% before tax and after price effects are considered. That figure would change with the actual trading price on the ex-date. In practice, many investors weigh such dividends against alternative income options and volatility risk, while also considering how the dividend aligns with their investment horizon and risk profile.
Practical steps for investors
To qualify for the Rs 13 dividend, you should hold HDFC Bank shares before the ex-date of 19 June 2026 and remain registered on the record date. If you acquire shares on or after the ex-date, you would typically miss this payout. Since the notice does not provide book closure dates, it is wise to confirm the exact timeline from official filings or the exchange. Aligning trading plans with corporate actions helps ensure you receive expected income without disrupting other parts of your strategy.
For retail investors, platforms like Swastika Investmart provide research snippets and market updates that help track corporate actions such as dividends. These resources can simplify understanding of when payouts are expected and how to position your portfolio accordingly. By staying informed, investors can avoid missing out on eligible dividends due to timing issues.
It is also worth noting the tax implications of cash dividends. In India, dividend incomes are generally taxable as part of total income, and tax treatment can vary across regimes and years. Investors should consult a tax advisor to understand how the Rs 13 per share payout fits into their personal tax situation and overall investment plan.
Tax considerations and corporate actions
Dividend payments are a form of shareholder value distribution and are distinct from capital gains. Regulatory filings and exchange notices remain the most reliable source for payout timing and any related corporate actions, including changes in capital structure or shareholder registers. Keeping an eye on these sources can help investors adjust expectations and avoid surprises around payout timing or eligibility.
Conclusion
The Rs 13 per share dividend for HDFC Bank, with ex-date and record date lined up for 19 June 2026, provides a defined income event for shareholders. While the headline amount is straightforward, the real takeaways include understanding eligibility, the interaction with stock price on the ex-date, and how this payout fits into a broader investment plan. Staying informed through official channels and reliable market updates supports a disciplined approach to dividend investing.
Frequently Asked Questions
What is the ex-date for HDFC Bank's dividend?
The ex-date is 19 June 2026, which determines who qualifies to receive the Rs 13 per share dividend.
How much dividend is being paid per share?
Rs 13 per equity share for the series EQ.
Why is the record date important?
The record date identifies shareholders who are eligible to receive the dividend; you must be registered as a holder by the record date.
Big Budget


.avif)
.avif)
.avif)
.avif)
.avif)


.avif)
.avif)
.avif)
.avif)
Latest Articles
.avif)
52 Week High Breakout Strategy in 2026: How Traders Spot Momentum Stocks & Should You Buy Them?


Summary
- Stocks hitting 52-week highs often indicate strong momentum and institutional interest
- Breakout traders use volume, price structure, and market sentiment to identify opportunities
- Buying at a 52-week high is not risky if supported by fundamentals and trend strength
- In 2026, momentum strategies remain relevant due to FII flows and sectoral leadership
- Risk management and stock selection are more important than timing the exact top
Introduction
In Indian stock markets, few events grab attention like a stock touching a 52-week high. For traders, it signals momentum. For investors, it raises an important question: Is it already too expensive?
As we move into 2026, with rising retail participation, algorithmic trading, and sharper institutional strategies, understanding 52-week high breakout stocks has become more important than ever. This blog explains how traders identify momentum stocks using breakout strategies and whether buying stocks at a 52-week high actually makes sense in Indian markets.
What Is a 52-Week High and Why It Matters
A 52-week high is the highest price a stock has traded at in the last one year. When a stock breaks above this level, it often enters uncharted territory, where there is no historical resistance.
Why traders track 52-week highs
- Indicates strong demand and bullish sentiment
- Shows confidence from institutional investors
- Often supported by improving fundamentals or sector tailwinds
- Attracts momentum traders and algorithmic strategies
In India, many market leaders like large-cap banks, IT stocks, and infrastructure companies have historically created long-term wealth after making repeated 52-week highs.
52-Week High Breakout Strategy: How Traders Spot Momentum Stocks in 2026
Momentum traders do not blindly buy every stock at a high. They look for specific confirmation signals.
1. Volume Expansion at Breakout
A genuine breakout is usually accompanied by higher-than-average trading volumes. This suggests participation from large players like FIIs, DIIs, and proprietary desks.
Example:
If a stock breaks its 52-week high with 2–3 times its average volume, it signals strong conviction rather than speculative buying.
2. Clean Price Structure
Traders prefer stocks that:
- Consolidated near highs
- Formed a tight range before breakout
- Show higher highs and higher lows
Such stocks often deliver smoother trends, reducing whipsaws.
3. Sector Strength and Market Context
In 2026, sector rotation continues to play a big role. Breakouts work best when:
- The broader market trend is positive
- The stock belongs to a strong-performing sector
- Sector indices are also near highs
For example, if capital goods or PSU banks are leading the market, stocks from those sectors breaking 52-week highs tend to sustain momentum longer.
4. Relative Strength vs Index
Smart traders compare stock performance against Nifty 50 or sectoral indices. A stock making a 52-week high while outperforming the index is often a momentum candidate.
Should You Buy Stocks at a 52-Week High in 2026?
This is one of the most searched questions among Indian investors. The answer is yes, but not blindly.
Common Myth
Many believe that stocks at 52-week highs are “overvalued.” In reality, strong stocks often remain strong.
When Buying at a 52-Week High Makes Sense
You can consider buying if:
- Earnings growth is visible and consistent
- Debt levels are manageable
- The sector outlook remains strong
- Institutional ownership is increasing
Historically, several Indian stocks that created long-term wealth spent years making new highs, not collapsing immediately after.
When You Should Avoid Buying
Avoid buying if:
- The rally is driven only by news or speculation
- Valuations have disconnected from earnings
- Volumes are declining at highs
- Broader market sentiment is weak
Risk management matters more than entry price.
52-Week High Strategy for Traders vs Investors
For Traders
- Focus on breakout confirmation
- Use strict stop-loss below breakout level
- Trail profits as the trend matures
For Investors
- Look at fundamentals, not just charts
- Prefer staggered buying instead of lump sum
- Monitor quarterly performance and guidance
Both approaches can coexist if aligned with your time horizon.
Role of FIIs and DIIs in 52-Week High Stocks
In Indian markets, FIIs and DIIs often accumulate quality stocks near highs, not lows. Rising institutional ownership near 52-week highs usually reflects confidence in future earnings growth rather than short-term speculation.
SEBI disclosures and exchange data regularly show increased institutional activity in momentum stocks during strong market phases.
Risk Management Is Non-Negotiable
Even the best breakout strategies fail without discipline. Traders and investors should:
- Avoid over-allocation to one stock
- Respect stop-loss levels
- Avoid chasing extended rallies
In 2026, with faster information flow and algo-driven volatility, risk control is your biggest edge.
How Swastika Investmart Helps Traders Track Momentum Stocks
At Swastika Investmart, SEBI-registered research and technology-driven tools help traders and investors:
- Track stocks hitting 52-week highs
- Analyze volume, momentum, and sector strength
- Access research-backed insights rather than noise
- Make informed decisions with proper risk frameworks
Our focus remains on education, disciplined investing, and research-led strategies.
👉 Open your trading account here
Frequently Asked Questions
Is buying at a 52-week high risky?
It can be risky if done without analysis. With strong fundamentals and trend confirmation, it can also be rewarding.
Do all 52-week high stocks continue rising?
No. Only stocks with earnings support and institutional interest tend to sustain momentum.
Are 52-week high strategies suitable for beginners?
Beginners should start cautiously and focus on learning risk management before active trading.
Do FIIs buy stocks at highs?
Yes, FIIs often buy stocks at highs when they expect long-term earnings growth.
Is this strategy relevant in volatile markets?
Yes, but stricter stop-losses and smaller position sizes are essential.
Conclusion
In 2026, 52-week high breakout strategies remain relevant for traders seeking momentum and investors looking for market leaders. The key is not avoiding highs, but understanding why a stock is making new highs.
With the right mix of technical confirmation, fundamental strength, and disciplined risk management, buying stocks at a 52-week high can be a strategy, not a mistake.
For research-backed insights and smarter investing tools, connect with Swastika Investmart, where market experience meets technology-driven decision-making.
Safeguard Duty Boosts Steel Shares as JSW, Tata, Jindal Surge
Key takeaways
- Safeguard duty on steel imports triggered a sharp rally in Indian steel stocks
- JSW Steel, Tata Steel and Jindal Steel emerged as key beneficiaries
- Policy move aims to protect domestic producers from cheap imports
- Improved pricing power and margins lifted investor sentiment
- Steel sector regained focus amid infrastructure and capex revival
Introduction
The announcement of safeguard duty boosting steel shares became one of the most talked about developments in Indian equity markets this year. Almost immediately, steel stocks rallied, with JSW Steel, Tata Steel and Jindal Steel leading the surge. For investors, this was not just a knee jerk reaction to a policy headline, but a signal of changing fundamentals in the domestic steel industry.
Safeguard duties are designed to protect local manufacturers from a sudden surge in imports. In India’s case, the move came at a time when global steel prices were under pressure and domestic producers were facing margin stress due to low cost imports. The policy intervention altered the demand supply equation overnight.
What Is a Safeguard Duty and Why It Matters
Understanding the Policy Move
A safeguard duty is a temporary import duty imposed to protect domestic industries from serious injury caused by rising imports. Unlike anti dumping duties, safeguard duties do not target specific countries. They apply broadly and are permitted under World Trade Organization rules.
In India, such measures are notified after detailed investigation and recommendations by the Directorate General of Trade Remedies, under the Ministry of Commerce.
Why Steel Was Chosen
The Indian steel industry had been witnessing a steady rise in imports, particularly from countries with surplus capacity. Domestic producers flagged concerns over pricing pressure and underutilization of capacity. The safeguard duty was introduced to restore balance and give Indian manufacturers breathing space.
Immediate Market Reaction: Steel Stocks Surge
JSW Steel: Margin Expansion Expectations
JSW Steel reacted positively as investors anticipated better realizations and improved margins. With lower import competition, domestic pricing power strengthened. Analysts also highlighted JSW’s operational efficiency and strong balance sheet as additional positives in a protected market environment.
Tata Steel: Domestic Focus Pays Off
Tata Steel’s Indian operations stood to benefit significantly from the safeguard duty. While its global exposure adds complexity, the domestic business gained pricing stability. The stock saw renewed buying interest from institutional investors looking for quality names within the steel space.
Jindal Steel: Leveraging Capacity and Demand
Jindal Steel and Power also emerged as a key beneficiary. With expanding capacity and exposure to infrastructure driven demand, the safeguard duty improved revenue visibility and earnings outlook.
Broader Impact on the Indian Steel Sector
Improved Pricing Power
The most immediate impact was on steel prices in the domestic market. Reduced import pressure allowed companies to stabilize prices, which is crucial in a capital intensive industry like steel where margins are highly sensitive to realizations.
Better Capacity Utilization
With imports becoming less attractive, domestic producers saw better capacity utilization. This is especially important as India continues to invest heavily in infrastructure, housing and manufacturing under various government initiatives.
Positive Sentiment Across Ancillary Industries
Ancillary sectors such as mining, logistics and capital goods also benefited indirectly. Higher steel production typically leads to increased demand across the value chain.
Market Context: Why the Timing Matters
Infrastructure and Capex Revival
India is in the midst of a multi year infrastructure push, spanning roads, railways, power and urban development. Steel remains a core input for all these segments. The safeguard duty aligns policy support with long term demand growth.
Global Steel Volatility
Globally, steel markets have been volatile due to fluctuating demand from China and uneven recovery across economies. By insulating domestic producers from external shocks, the safeguard duty reduced earnings uncertainty for Indian companies.
What Investors Should Watch Going Forward
Duration and Review of the Duty
Safeguard duties are temporary by nature. Investors should track government reviews and any changes in duty structure, as these can impact stock prices.
Cost Pressures and Raw Materials
While pricing power improves, companies still face raw material and energy cost risks. Efficient players with captive resources or long term contracts are better positioned.
Regulatory Oversight and Compliance
SEBI regulations ensure transparency in disclosures related to policy impact and earnings. Investors should rely on company filings and credible research rather than market speculation.
Role of Research Driven Investing
Policy driven rallies can be powerful but also volatile. Not every steel stock benefits equally. This is where structured research and disciplined investing become essential.
Platforms like Swastika Investmart, with SEBI registration, strong research tools and tech enabled investing platforms, help investors evaluate sectoral opportunities with clarity. Their focus on investor education and responsive customer support enables better decision making, especially during policy induced market moves.
Frequently Asked Questions
What triggered the rally in steel stocks?
The announcement of safeguard duty on steel imports reduced competition from cheaper imports, improving pricing power for domestic producers.
Which steel companies benefited the most?
JSW Steel, Tata Steel and Jindal Steel were among the biggest beneficiaries due to their scale, domestic exposure and operational strength.
Is safeguard duty permanent?
No. Safeguard duties are temporary and subject to periodic review by the government.
Does this policy help long term investors?
It can improve near to medium term earnings visibility, but long term returns still depend on efficiency, demand growth and cost control.
Conclusion
The development where safeguard duty boosts steel shares highlights how policy decisions can reshape sector dynamics. The rally in JSW, Tata Steel and Jindal reflects renewed confidence in India’s steel industry amid infrastructure growth and regulatory support.
For investors, such phases offer opportunities but also demand careful analysis. With its SEBI registered framework, in depth research capabilities and investor focused approach, Swastika Investmart supports informed participation in evolving market trends.
Gold, Silver and copper Defining Year: Why 2025 Became One of the Strongest Rallies in 40+ Years
Key takeaways
- 2025 marked one of the strongest rallies in gold, silver and copper in over four decades
- Global uncertainty, inflation hedging and energy transition drove commodity prices
- India saw direct impact on inflation, trade balance and equity sectors
- Metals regained importance as strategic assets, not just cyclical trades
- Investors needed disciplined research to navigate volatility
Introduction
The year 2025 will be remembered as a defining year for gold, silver and copper. Prices across all three metals surged sharply, creating what many analysts describe as one of the strongest commodity rallies in more than 40 years. Unlike short lived speculative spikes, this rally was backed by deep structural shifts in the global economy.
From central banks buying gold to the world accelerating towards electrification, the forces driving this rally were powerful and long term in nature. For Indian investors, the move had meaningful consequences, influencing inflation, currency movements, equity sectors and portfolio allocation decisions.
Why 2025 Turned Into a Historic Year for Metals
Global Uncertainty and Safe Haven Demand
Gold and silver benefited heavily from global uncertainty. Persistent geopolitical tensions, uneven global growth and concerns around sovereign debt pushed investors towards traditional safe havens.
Central banks, particularly from emerging markets, continued adding gold to their reserves. This steady institutional demand created a strong price floor for gold, while silver followed closely due to its dual role as a precious and industrial metal.
Inflation, Interest Rates and Currency Dynamics
While inflation cooled in parts of the world, it remained structurally higher than pre pandemic levels. Real interest rates stayed volatile, and currency fluctuations increased across major economies.
For investors, metals offered a hedge against purchasing power erosion. In India, the rupee’s movement against the dollar further amplified domestic gold and silver prices, making the rally more visible to retail participants.
Copper: The Metal That Redefined the Cycle
Electrification and Energy Transition
Copper emerged as the standout performer of 2025. Often called the backbone of electrification, copper demand surged due to rapid investments in electric vehicles, renewable energy, data centers and grid infrastructure.
A single electric vehicle uses significantly more copper than a conventional car. Multiply this across global adoption, and the demand story becomes clear.
Supply Constraints and Long Lead Times
Unlike gold, copper supply cannot respond quickly to price signals. New mines take years to develop, and environmental approvals have become stricter worldwide. This supply rigidity met accelerating demand in 2025, creating a classic imbalance that pushed prices sharply higher.
For Indian markets, this translated into renewed interest in metal stocks and mining linked businesses.
Impact of the Metal Rally on Indian Markets
Inflation and Consumer Impact
Higher gold and silver prices affected jewellery demand, particularly during wedding and festive seasons. While volumes softened at times, value growth remained strong.
Copper prices influenced input costs for sectors like power, construction, cables and electronics. Companies with pricing power managed better, while others faced margin pressure.
Equity Market Sector Rotation
Metal stocks regained leadership after years of underperformance. Investors rotated towards companies with exposure to mining, refining and metal processing.
At the same time, higher commodity prices acted as a double edged sword for manufacturing heavy sectors, making stock selection more critical.
Regulatory and Policy Context in India
From a regulatory standpoint, SEBI continued to strengthen commodity derivatives oversight, improving transparency and participation. Exchanges enhanced risk management norms, making commodity investing more robust for both hedgers and investors.
Gold, Silver and Copper as Portfolio Assets
Beyond Short Term Trading
The 2025 rally reinforced the idea that metals are not just tactical trades. They play a strategic role in diversified portfolios, especially during periods of macro stress.
Gold provided stability, silver offered volatility with upside, and copper represented growth linked to global development.
Importance of Research Driven Investing
Sharp rallies also bring sharp corrections. Investors chasing momentum without understanding fundamentals faced higher risk. This is where structured research, data driven insights and disciplined execution matter.
Platforms like Swastika Investmart, with SEBI registration, strong research tools and tech enabled investing solutions, help investors approach commodities with clarity rather than emotion. Continuous investor education and responsive customer support further add to informed decision making.
Real World Context: What Investors Experienced
A retail investor who added gold to their portfolio for stability found protection during equity volatility. Another who understood the copper supply story benefited from exposure to metal linked equities. On the flip side, those entering late without a plan experienced drawdowns during interim corrections.
This contrast defined 2025 as much as the rally itself.
Frequently Asked Questions
Why was 2025 considered a historic year for gold, silver and copper?
Because all three metals rallied together due to global uncertainty, inflation hedging and structural demand, something rarely seen at this scale in over 40 years.
Did Indian investors benefit from the metal rally?
Yes, through higher domestic prices, metal stocks, ETFs and improved portfolio diversification, though volatility remained high.
Is copper more of a growth metal than a safe haven?
Yes. Copper is closely linked to economic growth, electrification and infrastructure, unlike gold which is primarily a store of value.
Are commodities suitable for long term investors?
When used strategically and backed by research, commodities can enhance diversification and risk adjusted returns.
Conclusion
The gold, silver and copper defining year of 2025 reshaped how investors view commodities. This was not just a rally driven by fear or speculation, but one supported by structural changes in the global economy. For Indian markets, the impact was visible across inflation, equities and investor behavior.
Navigating such powerful trends requires more than headlines. It demands research, discipline and the right platform. Swastika Investmart, with its SEBI registered framework, advanced research capabilities and investor centric approach, supports investors in making informed choices across market cycles.

Record IPO Fundraising in 2025: How Tata Capital & LG India Led the Charge
Key takeaways
- 2025 became one of India’s biggest years for IPO fundraising by value
- Tata Capital and LG India emerged as marquee listings, boosting investor confidence
- Strong domestic liquidity and regulatory maturity supported the IPO boom
- The trend reshaped sectoral leadership and deepened capital markets
- Investors needed research-driven decision-making amid high valuations
Introduction
The record IPO fundraising in 2025 marked a defining moment for Indian capital markets. After years of cautious listings and selective investor appetite, 2025 saw a powerful resurgence, both in terms of the number of issues and the sheer amount of capital raised. At the center of this surge were two heavyweight names, Tata Capital and LG India, whose public issues not only grabbed headlines but also set the tone for the entire primary market.
For retail and institutional investors alike, this phase represented more than just big-ticket IPOs. It reflected confidence in India’s growth story, stronger regulatory oversight, and a maturing investor base willing to back quality businesses with long-term potential.
Why 2025 Became a Landmark Year for IPOs in India
Strong Economic and Market Backdrop
India entered 2025 with relatively stable macro indicators. GDP growth remained among the highest globally, corporate balance sheets improved, and inflation stayed within manageable limits. This environment created the perfect launchpad for large companies that had been waiting for the right time to go public.
Domestic mutual funds, insurance companies, and retail investors provided deep liquidity. Unlike earlier cycles where foreign flows dictated sentiment, Indian capital played a leading role in absorbing large IPO sizes.
Regulatory Confidence and SEBI Oversight
SEBI’s continuous focus on disclosure quality, pricing transparency, and investor protection enhanced trust in the IPO process. Clearer guidelines around offer-for-sale, anchor investor allocation, and risk disclosures ensured that large issues could be executed smoothly without excessive volatility.
This regulatory stability was a key reason why marquee names chose 2025 to tap the markets.
Tata Capital IPO: A Milestone for Financial Services Listings
Why Tata Capital’s Listing Mattered
The Tata Capital IPO was widely seen as one of the most anticipated financial services listings in recent years. As a diversified NBFC with exposure to retail lending, infrastructure finance, and corporate credit, Tata Capital offered investors a chance to participate in India’s credit growth story under the trusted Tata brand.
The issue attracted strong demand across categories, including long-term institutional investors, reflecting confidence in its governance standards and scalable business model.
Impact on the NBFC and Banking Space
Tata Capital’s listing re-rated the broader NBFC sector. Peer companies saw renewed investor interest, especially those with strong asset quality and prudent risk management. It also reinforced the idea that well-governed financial institutions could command premium valuations despite tighter regulatory norms.
LG India IPO: Bringing Global Consumer Strength to Dalal Street
Consumer Durables Meet Indian Equity Markets
LG India’s IPO was another highlight of the record IPO fundraising in 2025. With a deep footprint in Indian households across televisions, appliances, and electronics, LG’s public issue offered exposure to India’s consumption-led growth.
For investors, it combined global brand strength with local manufacturing, distribution, and demand dynamics.
What It Signaled for MNC Listings
The success of LG India encouraged other multinational subsidiaries to reconsider India as a listing destination. It showed that Indian markets could support large valuations while offering sufficient liquidity and analyst coverage for global businesses with strong domestic operations.
Broader Impact of Record IPO Fundraising in 2025
Sectoral Diversification
Unlike earlier IPO waves dominated by technology or PSU listings, 2025 saw balanced participation across financial services, consumer goods, manufacturing, and infrastructure. This diversification reduced concentration risk for investors allocating capital to primary markets.
Retail Investor Participation
Improved access through digital platforms, better investor education, and simplified application processes led to higher retail participation. However, with premium valuations in many issues, the importance of research-driven selection became even more critical.
Secondary Market Influence
Large IPOs increased market depth and free float, which in turn improved index representation and trading volumes. Over time, this strengthened India’s position in global emerging market indices.
How Investors Should Approach IPOs in Such a Bullish Phase
Focus on Fundamentals Over Hype
Record fundraising often brings aggressive pricing. Investors need to assess earnings visibility, return ratios, and competitive positioning rather than getting swayed by brand names alone.
Understand Regulatory Disclosures
SEBI-mandated prospectus disclosures provide valuable insights into risks, use of funds, and promoter background. Reading these carefully can help avoid post-listing disappointment.
Use Professional Research and Tools
This is where platforms like Swastika Investmart add value. With SEBI-registered credentials, robust research frameworks, and tech-enabled investing tools, Swastika helps investors analyze IPOs objectively. Strong customer support and ongoing investor education further empower informed decision-making.
FAQs
Why was 2025 a record year for IPO fundraising in India?
Strong economic growth, deep domestic liquidity, and regulatory stability encouraged large companies to go public.
What made Tata Capital’s IPO significant?
It offered exposure to India’s expanding credit market under a trusted corporate group, boosting confidence in NBFC listings.
How did LG India’s IPO impact the market?
It highlighted India’s attractiveness for multinational listings and strengthened the consumer sector’s presence in equity markets.
Are record IPO years risky for retail investors?
They can be if valuations are stretched. Careful analysis and long-term perspective are essential.
Conclusion
The record IPO fundraising in 2025 was not just about big numbers. It reflected India’s evolving capital markets, stronger governance, and growing investor sophistication. Listings like Tata Capital and LG India demonstrated that quality businesses, when priced and regulated well, can attract sustained interest across investor segments.
For investors navigating such dynamic phases, the right research, guidance, and technology make all the difference. Swastika Investmart, with its SEBI registration, in-depth research capabilities, and investor-first approach, stands out as a reliable partner in your investment journey.
%20(3).avif)
Indian Stock Market Opens Higher Today 31 December 2025: Nifty, Sensex & Bank Nifty
Early Market Snapshot
- Nifty 50 opens higher, extending positive momentum
- Sensex trades in the green with broad-based buying
- Bank Nifty shows stability, supporting the broader market
- IT stocks gain amid selective sectoral buying
Indian Stock Market Opens on a Positive Note
Indian equity markets began the final trading session of the year on a positive note on 31 December 2025, reflecting steady investor sentiment and mild optimism across key indices. Benchmark indices opened in the green, supported by selective buying in heavyweight stocks and stable global cues.
With year-end positioning underway, market participants appeared focused on quality stocks rather than aggressive bets, resulting in a controlled and orderly opening.
Opening Levels Across Key Indices
At the opening bell on 31 December 2025, major indices were trading as follows:
- NIFTY 50: 25,971.05 🟢 +0.12%
- BSE Sensex: 84,793.58 🟢 +0.14%
- NIFTY BANK: 59,194.60 🟢 +0.04%
- NIFTY IT: 38,051.70 🟢 +0.14%
The positive opening suggests steady participation from investors despite the typically lower volumes seen during year-end sessions.
Sensex and Nifty Show Stability
Both the Sensex and Nifty 50 opened higher, indicating a continuation of the consolidation phase seen in recent sessions. Buying interest in select large-cap stocks helped indices maintain positive territory in early trade.
The opening move reflects cautious optimism, with investors avoiding aggressive positioning while remaining invested ahead of the new calendar year.
Bank Nifty Holds Firm
The Bank Nifty opened marginally higher, signaling stability in banking stocks. While gains were modest, the index’s ability to hold above key levels continues to provide support to the broader market.
Private and PSU banks remained in focus as investors tracked sector-specific developments and year-end portfolio adjustments.
Nifty IT Shows Early Strength
The Nifty IT index also opened higher, supported by selective buying in IT majors. Stable global technology cues and expectations around steady demand trends helped the sector trade in the green during early hours.
IT stocks often attract attention during year-end sessions due to defensive characteristics and export-linked earnings visibility.
Market Sentiment and Global Cues
Global markets remained mixed but stable, offering limited directional cues. With no major overnight shocks, domestic markets focused on internal factors such as sector rotation, technical levels, and institutional positioning.
Low volatility and controlled price action suggest that investors are adopting a measured approach on the last trading day of the year.
What Investors Should Watch Today
- Sustenance of early gains amid low volumes
- Sector-specific moves in banking and IT stocks
- Any sudden volatility due to year-end adjustments
- Global market cues during European session
For traders, maintaining disciplined risk management remains essential, while long-term investors may continue to focus on fundamentally strong stocks.
How Swastika Investmart Helps Investors Stay Ahead
Navigating daily market moves requires timely insights and reliable research. Swastika Investmart, a SEBI-registered brokerage, supports investors with:
- Daily market updates and sectoral insights
- Advanced trading and investing platforms
- Strong customer support and expert guidance
- Investor education for informed decision-making
Whether markets are trending or consolidating, having the right tools and research can help you make smarter choices.
Final Word
The market opening updates for 31 December 2025 indicate a calm and positive start to the final trading session of the year. With benchmark indices opening higher, investors remain cautiously optimistic while staying selective.
If you’re looking to start the new year with a trusted trading partner, explore the opportunities with Swastika Investmart.
Stay informed. Trade smart. Invest with confidence.
%20(2).avif)
How to Read Market Sentiment Using FII & DII Data in 2026
Quick Takeaways
- FII and DII data offer valuable insight into institutional market sentiment
- Foreign and domestic flows often signal short-term and long-term trends differently
- Understanding context is more important than reacting to daily numbers
- Retail investors can use this data to time entries, manage risk, and stay disciplined
Why FII & DII Data Matters More Than Ever in 2026
In 2026, Indian stock markets are deeper, more liquid, and more globally connected than ever before. Daily market moves are no longer driven only by earnings or domestic news. Institutional money flows, especially from Foreign Institutional Investors (FIIs) and Domestic Institutional Investors (DIIs), play a crucial role in shaping market sentiment.
For retail investors and traders, learning how to read FII and DII data is no longer optional. It has become an essential skill to understand whether markets are driven by confidence, caution, or consolidation.
Who Are FIIs and DIIs?
Foreign Institutional Investors (FIIs) include overseas funds, pension funds, hedge funds, and global asset managers investing in Indian equities. Their actions are often influenced by global factors such as US interest rates, currency movements, geopolitical events, and risk appetite.
Domestic Institutional Investors (DIIs) include mutual funds, insurance companies, banks, and pension funds based in India. Their investment decisions are typically aligned with domestic economic growth, corporate earnings, and long-term capital allocation.
Together, FII and DII flows provide a powerful lens to read institutional thinking.
Understanding Market Sentiment Through FII Activity
In 2026, FII data continues to act as a sentiment indicator, especially for short-term market direction.
When FIIs are consistently buying, it often signals:
- Positive global risk appetite
- Confidence in India’s macroeconomic outlook
- Strength in large-cap and index-heavy stocks
On the other hand, sustained FII selling may reflect:
- Global uncertainty or risk-off sentiment
- Rising bond yields in developed markets
- Currency-related concerns
However, smart investors do not react to one-day data. Instead, they observe trends over multiple sessions to understand whether selling or buying is structural or temporary.
Why DII Flows Are Equally Important in 2026
One major shift in recent years has been the growing influence of DIIs. With rising SIP inflows, insurance participation, and retirement funds, domestic money has become a stabilizing force for Indian markets.
Strong DII buying during FII selling often indicates:
- Long-term confidence in Indian growth
- Institutional accumulation during market dips
- Reduced downside risk for indices
In 2026, many market corrections are absorbed faster due to steady domestic inflows. This makes DII data critical for long-term investors.
How to Read FII & DII Data Together
The real insight comes from reading FII and DII data in combination, not isolation.
Here are common scenarios and what they indicate:
FIIs buying, DIIs buying
This is a strong bullish signal. Markets often trend higher with better breadth and momentum.
FIIs selling, DIIs buying
This usually signals market resilience. Corrections tend to be shallow and short-lived.
FIIs buying, DIIs selling
Often seen during sharp rallies where domestic institutions book profits.
FIIs selling, DIIs selling
This is a cautionary phase, usually seen during global or domestic stress.
Understanding these patterns helps investors avoid emotional decisions.
Cash Market vs Derivatives Data
In 2026, many investors also track FII positioning in derivatives such as index futures and options.
- Cash market data reflects actual investment flows
- Derivatives data shows hedging, speculation, and rollover activity
It is important to remember that derivative positioning can change rapidly due to expiries and does not always reflect directional conviction. SEBI-regulated research platforms often emphasize using cash market flows as the primary sentiment indicator.
Common Mistakes Retail Investors Make
Many retail investors misinterpret FII and DII data by:
- Reacting to one-day inflows or outflows
- Ignoring global context
- Assuming FII selling always means a crash
- Overtrading based on headlines
In reality, FII data works best as a confirmation tool, not a standalone trading signal.
How Retail Investors Can Use This Data Practically
For long-term investors, FII and DII data can help:
- Stay calm during market volatility
- Accumulate quality stocks during institutional buying
- Avoid panic selling during temporary corrections
For traders, it can help:
- Align trades with broader sentiment
- Avoid counter-trend positions
- Manage risk during volatile sessions
Platforms that combine flow data with technical and fundamental insights make this process easier and more effective.
Regulatory Transparency and Data Availability
In India, FII and DII data is published daily by stock exchanges and monitored under SEBI regulations. This transparency ensures that retail investors have equal access to institutional flow information, reinforcing trust and fairness in the market ecosystem.
How Swastika Investmart Helps Investors Decode Market Sentiment
Interpreting institutional data correctly requires context, experience, and reliable research. Swastika Investmart, a SEBI-registered brokerage, supports investors by providing:
- Institutional flow analysis with market context
- Research-backed insights across equity and derivatives
- Tech-enabled platforms for smarter decision-making
- Ongoing investor education to build long-term confidence
Whether you are a trader tracking daily sentiment or an investor planning for the long run, having the right guidance matters.
Frequently Asked Questions
Is FII data enough to predict market direction?
No. FII data should be used along with technical levels, earnings trends, and global cues.
Why do FIIs sell even when Indian fundamentals are strong?
FII decisions are often driven by global factors such as interest rates, currency movements, and portfolio rebalancing.
Can DIIs fully offset FII selling?
In many cases, strong domestic inflows help limit downside, but global sentiment still influences short-term moves.
Is FII data useful for long-term investors?
Yes. It helps investors understand accumulation and distribution phases without reacting emotionally.
Where can investors track reliable FII & DII data?
Stock exchange disclosures and SEBI-registered research platforms provide transparent and timely data.
Final Thoughts
In 2026, understanding how to read market sentiment using FII and DII data gives Indian investors a significant edge. Instead of reacting to noise, informed investors focus on trends, context, and discipline.
If you want to invest or trade with deeper market insight backed by research and technology, consider getting started with Swastika Investmart.
Smart analysis. Informed decisions. Confident investing.


.avif)
.avif)

.avif)


START YOUR INVESTMENT JOURNEY
Get personalized advice from our experts
- Dedicated RM Support
- Smooth and Fast Trading App
