The Power of Compounding – Why Starting Early Matters


Introduction
Albert Einstein reportedly called compound interest the "eighth wonder of the world." Whether or not he actually said it, the math is undeniable. Compounding is the process where your investment returns begin earning their own returns — and over time, this snowball effect becomes truly extraordinary.
The catch? Compounding needs one essential ingredient: time.
The more years you give your money to grow, the more dramatic — and life-changing — the results become. This is exactly why starting your investment journey early, even with a modest amount, can make a difference of crores by the time you retire.
A Tale of Two Investors: Arjun vs Priya
Let's bring this concept to life with a simple, real-world example.
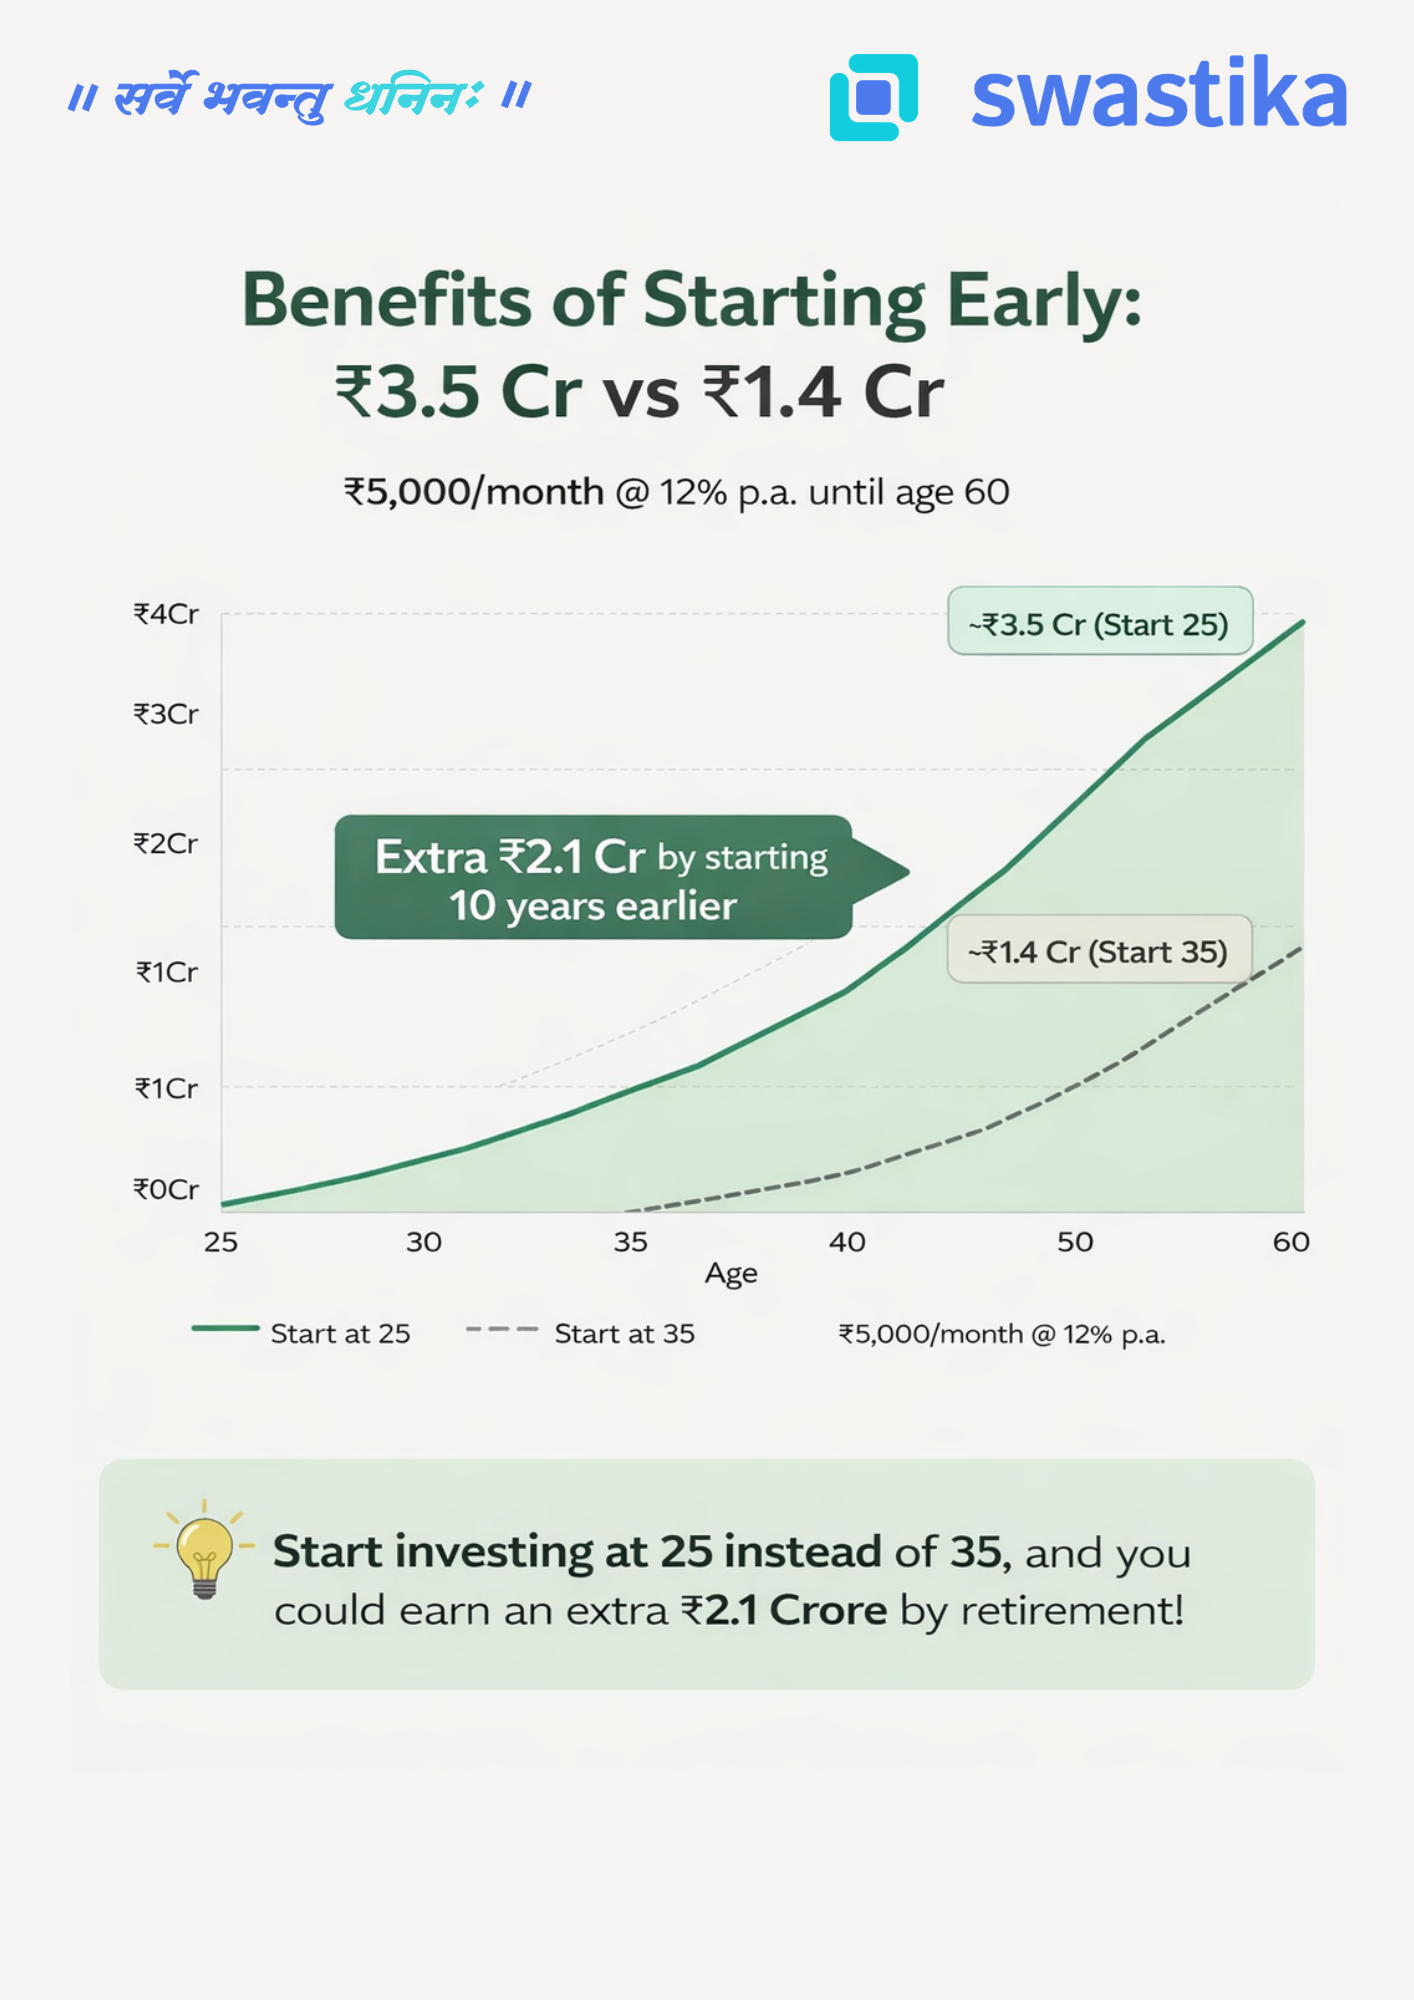
Meet Arjun and Priya. Both are sensible, disciplined investors. Both invest ₹5,000 every month through a SIP (Systematic Investment Plan) in equity mutual funds, earning an average annual return of 12%. Both stop investing at age 60.
The only difference? Arjun starts at 25. Priya starts at 35.
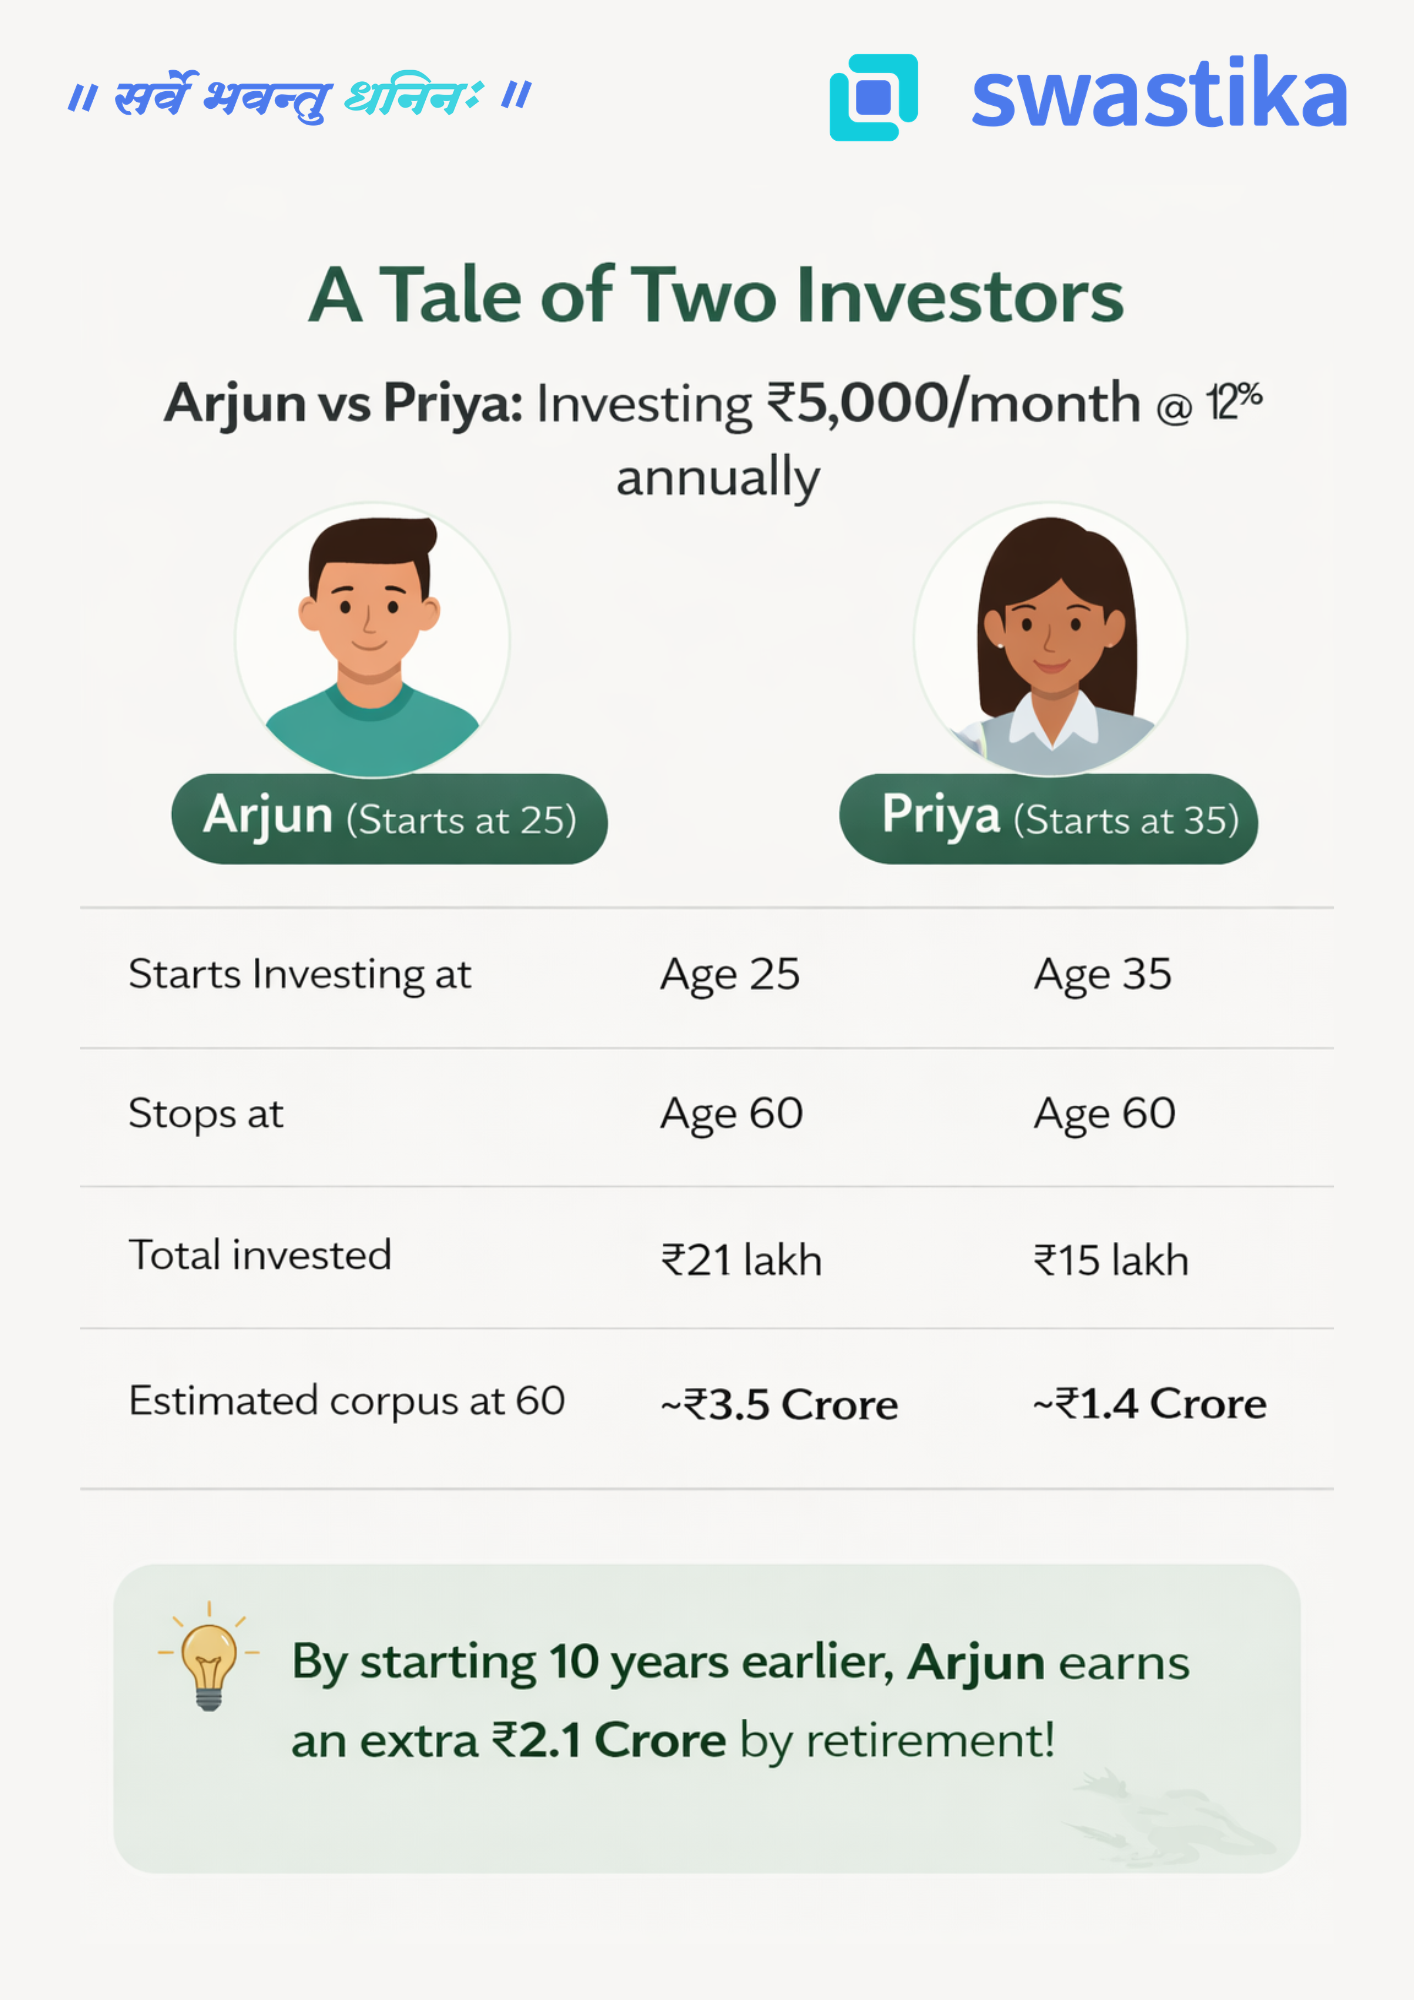
The numbers are striking. Arjun invests just ₹6 lakh more than Priya in absolute terms — yet walks away with ₹2.1 Crore more at retirement.
That extra ₹2.1 Crore didn't come from investing more aggressively or taking bigger risks. It came purely from starting 10 years earlier.
Why Does Time Make Such a Huge Difference?
This is where the magic of compounding reveals itself.
In the early years of investing, growth looks modest and almost unimpressive. But as the years pass, your corpus grows not just on your original investment, but on all the accumulated returns from previous years. The curve goes from almost flat to steeply exponential — and that steep climb happens in the later years.
When Arjun starts at 25, his money has 35 years to ride that exponential curve. Priya's money, starting at 35, only catches the last 25 years — and critically, it misses the steepest part of the climb in the final decade.
Think of it this way: the last 10 years of compounding are worth more than the first 20. That is the counterintuitive truth at the heart of long-term investing.
The Real Cost of Waiting
Many young earners tell themselves, "I'll start investing once I'm more settled — once the salary improves, once the EMI is paid off, once life is a bit easier."
But the numbers show that every year of delay is extraordinarily expensive — far more expensive than any EMI or lifestyle expense. Priya didn't invest carelessly. She invested faithfully for 25 years. Yet she ends up with less than half of what Arjun accumulated — not because she did anything wrong, but simply because she started a decade late.
The cost of waiting 10 years wasn't ₹6 lakh in additional contributions. The cost was ₹2.1 Crore in lost wealth.
Three Principles to Remember
1. Start now, not later.The best time to start investing was yesterday. The second best time is today. Even a SIP of ₹1,000–₹2,000 per month in your 20s is infinitely better than waiting for the "right time."
2. Consistency beats intensity.You don't need to invest large sums all at once. A small, steady, monthly commitment — maintained without interruption — is what unlocks the full power of compounding over decades.
3. Stay invested through market cycles.Compounding works only if you let it work. Exiting during market corrections or stopping your SIP in tough months breaks the chain. Time in the market, not timing the market, is what builds wealth.
The Bottom Line
If you are in your 20s or early 30s, you hold an asset that no amount of money can buy later: time. Use it. Start a SIP today — even a small one. Let compounding do its slow, steady, powerful work.
Because the difference between starting at 25 and starting at 35 is not just 10 years. As Arjun and Priya's story shows, that difference is ₹2.1 Crore.
Big Budget


.webp)
.webp)
.webp)
.webp)
.webp)


.webp)
.webp)
.webp)
.webp)
Latest Articles

What is NFO - Get a Detailed Insight into New Fund Offers


Mutual fund houses are increasingly coming up with new fund offer (NFO) to attract stock market trading investors. In the last 5-6 months, we have seen multiple NFOs from mutual fund companies.
Mutual funds have become more popular with retail investors in the recent past, following their participation in the collections of non-fund operational (NFO) income by the mutual fund houses.
What is a New Fund Offer (NFO)?
New Fund Offers (NFOs) are launching new mutual fund schemes.
Mutual fund houses keep coming up with new products, especially when there is an increased inflow into the equity markets.
In other words, New Fund Offer (NFOs) are mainly launched when the markets have shown good returns in the last six months to 1 year, and they rarely come in bear markets.
In the first quarter of March 2020, hardly any new financial instruments were issued, while equity markets were down more than 25% over the month.
If you want to invest in an NFO, you need to purchase units during its initial offering period.
After the initial offering period ends, you can buy/sell units on any business day from the mutual fund house that manages the scheme.
How Does a New Fund Offer Work?
The investors may purchase the mutual fund scheme units during the pre-defined period and subscribe to the NFO at an offer price, which is usually fixed at ₹10.
Once the tenure expires, investors can purchase the fund units at the specified price.
NFO subscribers, overall, have been able to generate better gains post-listing.
Because in the case of an NFO, there are no historical data or performance metrics available for analysis by investors.
They have to rely on data about similar schemes offered by the same AMC or trust houses offering similar schemes.
Open-ended schemes are much more popular than NFOs as they allow investors to enter and exit at any point in time and trade their units on stock exchanges like any other equity share.
NFOs can be invested through SIP (systematic investment plan) or a lump sum amount.
It offers convenience and tax benefits through SIPs (under section 80C).
Investors can also choose between dividend and growth plans depending on their requirements and risk appetite.
Only a limited number of new funds are open to the public, so if you have any interest in getting one, we would suggest you apply now.
Things You Need to Ponder While Investing in NFOs
Old Wine in a New Bottle
Investors must be aware that various new schemes are launched every year with a slight difference in investment objective than the existing schemes.
It would help if you did not fall prey to such schemes. Such schemes are known as old wine in new bottles, introduced with a slight change in name or investment objective to attract investors.
Risk Factor
Every mutual fund scheme has a specific risk factor associated with it.
Investors should understand their risk appetite and then invest in mutual funds accordingly.
If they can’t understand whether the scheme is suitable for them or not, they must seek help from a financial advisor or SEBI-registered investment advisor.
Cost of Investment
The cost of an NFO will be high due to all expenses related to marketing and advertising.
The price is high because the AMC will also try to make money from these expenses rather than only from managing an investor’s portfolio assets.
Track Record of Fund House
All fund houses have different risk and return profiles. Investors should check their track record of the fund house by looking at the past performance of its schemes.
If a fund house has performed well in the equity market for an extended period, then it is considered that it has been able to create wealth for its investors.

मुद्रास्फीति में बढ़ोतरी से कीमती धातुओं में तेज़ी।
पिछले सप्ताह अमेरिकी उपभोक्ता मूल्य सूचकांक (सीपीआई ) के आकड़ो में बढ़ोतरी दर्ज की गई है। फ़ूड, एनर्जी और औद्योगिक धातुओं की कीमतों में लगातार बढ़ोतरी होने से मुद्रास्फीति में बढ़ोतरी का अनुमान रहा जिसके कारण पिछले सप्ताह में सोने के भाव में लगातार तेज़ी देखि गई। गुरुवार को जारी अमेरिकी आंकड़ों से पता चला है कि जनवरी में उपभोक्ता मूल्य सूचकांक (सीपीआई) साल-दर-साल 7.5 प्रतिशत और महीने-दर-महीने 0.6 प्रतिशत बढ़ा है।
कोर सीपीआई महीने-दर-महीने 0.6 प्रतिशत और साल-दर-साल 6 प्रतिशत बढ़ा है। यह 40 वर्षों में मुद्रास्फीति में सबसे बड़ी वार्षिक वृद्धि है। घरेलु वायदा सोने में 1000 रुपये प्रति दस ग्राम तक की तेज़ी देखि गई, हालांकि, मुद्रास्फीति लगातार बढ़ने के कारण निवेशकों द्वारा 50 आधार अंक की बढ़ोतरी की अटकले लगाई जाने लगी है जो अभी 0.25 आधार अंक बढ़ने का अनुमान है। जिससे सोने के भाव में सप्ताह के अंत में मुनाफा वसूली भी देखि गई और भाव 48750 रुपये प्रति दस ग्राम के स्तरों पर रहे।
शुक्रवार को सेंट लुइस फेड के अध्यक्ष जेम्स बुलार्ड ने सीपीआई के आंकड़े जारी होने के बाद कहा कि वह अगली तीन नीति बैठकों में फेड से दरों में पूर्ण बढ़ोतरी की उम्मीद रखते हैं। रेट फ्यूचर सर्वे के मुताबिक 62 प्रतिशत संभावना का संकेत है कि केंद्रीय बैंक मार्च 2022 में जेम्स बुल्लार्ड की टिप्पणी के बाद ब्याज दरों में 50 आधार अंकों की वृद्धि करेगा, यह सम्भावना बुधवार तक 30 प्रतिशत पर थी। जिसके कारण 10 वर्षीय अमेरिकी बॉन्ड यील्ड 2 प्रतिशत के उच्च स्तरों पर पहुंच गई है।
पूर्वी यूरोप में भू-राजनीतिक तनाव भी जारी है क्योंकि रूस और यूक्रेन की फ्रांस और जर्मनी के साथ बातचीत में कोई सफलता हासिल करने में विफल रहे हैं। यूक्रेन के मामले पर रूस ने नाटो में शामिल देशो को कड़ी चेतावनी दी है। भू-राजनीतिक तनाव सोने और चांदी के भाव को लगातार सपोर्ट कर रहा है।
तकनिकी विश्लेषण
इस सप्ताह सोने और चांदी के भाव में तेज़ी रह सकती है। अप्रैल वायदा सोने में 48400 रुपये पर सपोर्ट है और 49000 रुपये पर प्रतिरोध है। मार्च वायदा चांदी में 61200 रुपये पर सपोर्ट और 65000 रुपये पर प्रतिरोध है।
Best Tips to Select Stocks for Intraday Trading
How to Select Intraday Trading Stocks in India?
Intraday trading refers to the buying and selling of stocks on the same day. It is done using online trading platforms.
Intraday trading is considered riskier than investing in the regular stock market. It is important, especially for beginners, to understand the basics of such trading to avoid losses.
Let’s understand it with an example:
If you buy a stock at Rs. 500 and sell it at Rs. 550, you make an intraday profit of Rs. 50 per share (if all the shares were bought and sold).
So, Intraday Trading has its advantages and disadvantages. Intraday traders can make money when the market is volatile, but they can also lose a lot if they are not careful.
Hence, it is essential to know the factors that determine profits in intraday trading.
Trade with the Trend
The concept behind Trade with the Trend is that most traders don't have time in their schedule to watch for news events, but they can watch for technical signals that can predict trends.
Traders can also watch for support and resistance levels that may be reached as a result of market movement.
Resistance and support are arguably some of the most widely discussed concepts in technical analysis.
In its most basic sense, resistance indicates a price level that is likely to act as a barrier to the price of an asset, preventing it from getting pushed in that direction.
The principle behind "Trade with the Trend" is that many traders lack the time to monitor news events but can focus on technical signals that predict market trends. Traders should also observe support and resistance levels, which are critical concepts in technical analysis.
Support and resistance levels are pivotal in determining price movements. Support refers to a price level where an asset is likely to experience buying interest, preventing its price from falling further. Conversely, resistance is a price level where selling pressure may arise, hindering the asset's price from rising beyond that point.
If buying pressure is strong at a support level, the price is likely to bounce back and move upwards. Conversely, if selling pressure is significant at a resistance level, the price may reverse and direction will change after hitting resistance.
Click Here to Open Demat Account
Liquid Stocks
When you plan to trade intraday, you need to be sure that you can buy and sell large volumes of stock without affecting the price.
These are essential for two reasons:
- You don't want to pay more than the current price by buying a large amount of stock in one transaction.
- You don't want to wait around while your order is being executed if there is any chance of the price moving against you.
The only way to be sure that a sudden move in the price does not impact you is to buy or sell very small amounts of stock at a time.
Tick-size trading depends on having liquid stocks to allow even tiny transactions to be executed swiftly.
Know About the Charts
Once you have been trading for a while, you will get to know the characteristics of various stocks.
Many stock trading investors know about charts, it is important to identify stocks that are likely to be the right stock to trade.
The most vital tool in your utility belt is a strong chart pattern recognition ability.
Once you gain proficiency at reading charts, you can spot the formation of stock patterns and trade accordingly.
It is essential as an intraday trader that you are familiar with chart patterns.
By default, every stock will move in an overall trend direction.
There is a bull trend, and there is a bear trend. In other words, the market will move in one direction or another for a long time at a stretch.
As an intraday trader, you need to know these trends so that you can make good decisions regarding the buying and selling of stocks.
The best way to spot market trends is by looking at charts of stocks for which there are historical records available for a long period.
This will give you an idea about how the stock has behaved over time and how it behaves during different phases of its life cycle.
Medium to High Volatility
There are two kinds of intraday breakouts.
The first one is when you see a stock breaking out in the early morning hours around 9:45 am and 10 am, and then it starts moving up or down in the regular trading hours and forms a top or bottom.
The second type is when a stock closes above or below its opening price in the first few minutes of opening the market.
The first type presents good entry points for long positions, while the second gives you good entry points.
The best way to identify breakout stocks is to keep an eye on your trading platform's Top Gainers and Losers list.
Once you have shortlisted stocks, keep an eye on their daily prices, especially in the first 10 minutes after the market opens.
If you find a stock that has broken out, then place an order to buy or sell as soon as possible so that you don't miss out on the opportunity to make some money from it.
Start your Online Stock Trading journey today
Stocks that are Price Sensitive to News Flows
If you are a day trader, you need to have a stock list that is extremely sensitive to news.
These stocks are best for trading because they fluctuate rapidly with new information and thus offer traders numerous trading opportunities. They also allow a trader to capture profits quickly.
There are essentially two types of Intraday traders in India.
The first one is the one who trades on fundamentals and technicals.
The second type of trader watches the news for trading opportunities.
Conclusion
Selecting the right stocks for intraday trading is a crucial aspect of achieving consistent success in the stock market. By focusing on factors such as liquidity, volatility, market trends, and the alignment of technical indicators, traders can improve their chances of making profitable trades. It is also important to stay updated on news, set stop-loss orders, and have a disciplined trading strategy in place. Intraday trading requires patience, risk management, and continuous learning. By applying these best practices, traders can navigate the dynamic nature of intraday trading more effectively and optimize their returns.

Upcoming IPOs in February 2022
Important Details of Upcoming IPOs in 2022
In the year 2021, we saw many companies launching their IPOs to make an entrance into the public market.
From January to December, a minimum of 3 companies have become public every month.
Following the last year, there are other companies too, who are looking forward to making their debut in the primary market.
The IPO information is crucial for every stock market trading investor.
In this blog, we will talk about all the upcoming IPOs in February 2022 so that you can take a call on investing or not.
Upcoming IPOs List for February 2022
Sr No Name of the Company Issue Size Opening Date Closing Date 1 Vedant Fashion Ltd₹3,149.19 Cr February 4, 2022February 8, 2022 2 Go Airlines Ltd ₹3,600 Cr*To be announced To be announced 3 Mobikwik Systems Ltd ₹1900 Cr* To be announced To be announced 4 Jana Small Finance Bank ₹2,000 Cr* To be announced To be announced 5 Arohan Financial Services Ltd ₹850 Cr* To be announced To be announced 6 Ixigo (Le Travenues Technology) Ltd₹1,600 Cr*To be announced To be announced
Vedant Fashion Ltd
Vedant Fashions, India's largest private label apparel and lifestyle brand, will hit the primary markets on February 4 with an IPO that will be an offer for sale by the company's promoters.
The Rs 3,149 crore offer will give the existing shareholders and promoters of the company a chance to monetize their investment.
Vedant Fashion Ltd., an Indian clothing company, owns several brands such as Manyavar, Mohey, Mebaz, Manthan, and Twamev.
It operates through franchise-owned outlets (EBOs), as well as multi-brand outlets (MBOs) and large format stores (LFSs).
The company also has an online presence on its website and mobile application. As of September 30, 2021, it had over 1.2 Mn sq. ft of retail space in India and 11 EBOs overseas.
It has announced plans to go public on February 4, 2022, with a total issue size of ₹3149.19 crores for sale.
MobiKwik Systems Limited
In 2009, MobiKwik Systems Limited began its operations with MobiKwik Wallet. This allowed users to load money into a mobile wallet and make payments with a single click.
Mobikwik is one of the largest mobile wallets and Buy Now Pay Later (BNPL) players in India. The company also offers payment gateway services to e-commerce merchants.
They aspire to provide credit to India's growing online population, and they offer a range of products to help with that goal, including peer-to-peer payments via UPI, MobiKwik Wallet, and MobiKwik Wallet to bank payments through their platform.
Their IPO has a valuation of INR 1900 crore. It involves a fresh share offering worth up to INR 1,500 crore, and 400 crores in an offer for sale.
Jana Small Finance Bank
One of the major players in the small financing scenario of the country, Jana Small Financing Bank (JSFB), will launch its initial public offering (IPO) with an issue size of Rs. 2,000 crores.
This IPO will include both an offer for sale (OFS) of Rs. 1,300 crores and fresh issue of shares worth Rs. 700 crores.
Finance bank Jana Small Finance Bank is raising funds through an initial share-sale worth Rs 700 crore, according to a draft red herring prospectus filed with the SEBI.
The company offered up to 92.53 lakh (9.25 million) shares to new investors in an issue of equity shares worth Rs 700 crore.
Go Airlines Ltd
GoAir, India's 5th largest airline, filed its draft red herring prospectus with India's Securities and Exchange Board (SEBI) for an initial public offering worth ₹3600 crores.
The Wadia Group-owned the Mumbai-based airline, which began in 2005. The company name was GoAir, but they recently rebranded to GoFirst.
They fly 300 flights per day to 36 different domestic and international destinations; they have a market share of around 8.4%.
Go Airlines is India's ultra-low-cost airline that focuses on young Indians, leisure customers, and MSME business travellers.
The retail portion of the IPO is 10%, while QIB is 75% and NII is 15%. They will be listed on NSE and BSE, both indices.
Arohan Financial Services Ltd
Arohan, set up in 2006, is the largest non-banking financial company microfinance institution in the eastern Indian region with a gross loan portfolio of Rs. 4600 crore in FY21.
It raised Rs. 189 crore from ASK Financial Holding, Kiran Vyapar Ltd, and Arohan ESOP Trust at Rs. 210 per share between FY17 and FY20.
Its gross loan portfolio was Rs. 48.57 billion, the highest among all non-banking financial company microfinance institutions in eastern India. It is the fifth-largest NBFC-MFI in India based on the gross loan portfolio.
Between FY17 to FY20, it had the second-highest CAGR (which signifies compound annual growth rate) of 68% among the top five NBFC-MFIs in India and the highest customer growth among the top five NBFC-MFIs at 49% CAGR between FY18 to FY20.
Ixigo (Le Travenues Technology Limited)
Ixigo (Le Travenues Technology Limited), a technology company, focuses on empowering Indian travelers.
We assist travellers in making better travel decisions by leveraging artificial intelligence, machine learning, and data science-led innovations on our OTA platforms.
Ixigo's vision is to become India's leading travel ecosystem for the following billion users driven by technology, cost-efficiency, and their culture of innovation.
They have OTA platforms that allow travelers to book train tickets, flight tickets, bus tickets, hotels, and cabs while providing travel utility tools and services.
They offer train PNR status and confirmation predictions, train seat availability alerts, train running status updates and delay predictions, flight status updates, bus running status, pricing, availability alerts, deal discovery, destination content, personalized recommendations, and instant fare alerts flights.
They also provide automated customer support services.
Everyone is waiting for the Upcoming IPOs in February, you can’t Trade when you do not have a Demat account.
अमेरिकी डॉलर इंडेक्स में गिरावट से मजबूत हुआ सोना।
सोने और चांदी की कीमतों के लिए पिछले सप्ताह अस्थिर रहा लेकिन अप्रैल वायदा सोने के भाव सप्ताह में 0.8 प्रतिशत तेज़ हुए और 47950 रुपये प्रति दस ग्राम के स्तरों पर कारोबार करते दिखे। रूस-यूक्रेन के तनाव से सोने के भाव को सपोर्ट मिल रहा है। सोने के विपरीत दिशा में चलने वाला, अमेरिकी डॉलर इंडेक्स में पिछले सप्ताह जबरदस्त बिकवाली का दबाव रहा और इसमें 2 प्रतिशत की साप्ताहिक गिरावट दर्ज की गई है। अमेरिकी डॉलर इंडेक्स में यह गिरावट मार्च 2020 के बाद सबसे अधिक रही है।
पिछले साप्ताहिक सत्र के दौरान कॉमेक्स वायदा सोना 1800 डॉलर प्रति औंस के निशान के ऊपर ही रहा क्योंकि कमजोर डॉलर और अमेरिकी ट्रेजरी यील्ड में उछाल से शेयर बाजारों में जोखिम बढ़ने लगा है जिससे सोने में निवेश बढ़ा है। गोल्ड एसपीडीआर गोल्ड ट्रस्ट की होल्डिंग में बढ़त दर्ज की गई है। बैंक ऑफ़ इंग्लैंड ने पिछले सप्ताह अपनी मौद्रिक नीति में ब्याज दरों को बढ़ा कर 0.5 प्रतिशत कर दिया और यूरोपियन सेंट्रल बैंक द्वारा जारी मौद्रिक नीति में ब्याज दरे यथावत रखी। यूरोप में बढ़ती हुई मुद्रास्फीति को लेकर यूरोपियन सेंट्रल बैंक का मानना है की यह इस साल के अंत तक कम हो जाएगी।
प्रमुख बैंक की मौद्रिक नीति होने से पिछले सप्ताह कीमती धातुओं के भाव में काफी उठा पटक देखि गई है। उधर, अंतर्राष्ट्रीय मुद्रा कोष ने चेतावनी दी कि यह कहना बहुत जल्दी होगा कि दुनिया "निरंतर मुद्रास्फीति" की अवधि का सामना कर रही है। इस बीच, यूक्रेन को लेकर अमेरिका-रूस के बीच तनाव लगातार बढ़ता जा रहा है। अमेरिका का मानना है कि रूस ने यूक्रेन पर आक्रमण करने के बहाने के रूप में कई विकल्प तैयार किए हैं, जिसमें एक प्रचार वीडियो का संभावित उपयोग शामिल है। जो सोने के भाव के लिए तेज़ी का संकेत कर रहे है।
तकनिकी विश्लेषण
सोने और चांदी के भाव में इस सप्ताह तेज़ी रह सकती है। सोने को 47400 रुपये पर सपोर्ट और 48300 रुपये पर प्रतिरोध है। चांदी को 59800 रुपये पर सपोर्ट और 62400 रुपये पर प्रतिरोध है।

Vedant Fashion Limited IPO
Incorporated in 2002, Vedant Fashions Limited caters to the Indian wedding and celebration wear market with a diverse portfolio of brands. The company offers a one-stop destination with a wide spectrum of product offerings for every celebratory occasion to its customers.
The company's brands include (i) Manyavar, (ii) Mohey, (iii) Mebaz, (iv) Manthan, and (v) Twamev. The company operates its business through franchise-owned exclusive brand outlets (EBOs), with the remaining by multi-brand outlets (MBOs), large format stores (LFSs), and online platforms, including its website (www.manyavar.com) and mobile application.
- Vedant Fashions was the largest in India in the men's Indian wedding and celebration wear segment in terms of revenue, OPBDIT, and profit after tax for the Financial Year 2020. According to CRISIL, its ‘Manyavar’ brand is a category leader in the branded Indian wedding and celebration wear market with a pan-India presence, as of Financial Year 2020.
- As of September 30, 2021, the company had a retail footprint of 1.2 Mn sq. ft covering 535 EBOs (including 55 shop-in-shops) spanning 212 cities and towns in India, and 11 EBOs overseas across the United States, Canada, and the UAE.
- Company have focused on spreading India’s vibrant culture, traditions and heritage through its aspiration yet value for money brands at a diverse range of price points. It offers a one-stop destination with a wide spectrum of product offerings for every celebratory occasion.
- The company's distributors are in 28 states and 8 union territories throughout India, catering to over 1.6 million retail outlets. As of September 30, 2021, the company had 88 depots in India, with an aggregate storage space of approx. 1.8 million square feet across the country.
Outlook & Valuation
The company has mixed set of financials over the few years where the revenue grew in FY20 and fell back from Rs. 9,47.97 cr to Rs 625 cr in FY21. Similarly, profit also declined from Rs. 236.6 cr in the year FY20 to Rs. 132.9 cr in the FY21 which can be attributed due to the pandemic. However, the company's performance returned to normal in the first 6 months of FY22. Vedant Fashions is among the top companies in the Indian wedding and celebration wear segment. The company's financials suffered a setback, which could be due to COVID 19. The issue is valued at P/E 161(x) to its FY21 EPS of Rs. 5.36 and P/BV of 24.42(x) on NAV of 35.45 that seems to be overpriced also the issue is purely OFS based. Thus we assign an "AVOID" rating to the IPO.
KEY MANAGERIAL PERSONNEL
- Ravi Modi is the Chairman and Managing Director of the Company. He has been associated with the Company since its inception. He has more than two decades of experience in the garment industry. He oversees the design and marketing functions of the Company
- Shilpi Modi is the Whole-time Director of our Company. She has been associated with the Company since its inception. She has more than two decades of experience in the garment industry.
- Rahul Murarka, is the Chief Financial Officer of the Company.. He has over 16 years of experience in finance, accounting, audits, taxation and regulatory compliances.
- Navin Pareek is the Company Secretary and Compliance Officer of the Company. He has over 10 years of experience in legal, compliance, finance, direct taxation and secretarial functions.
- Amar Sethia, is the Chief Product Officer of the Company. He is engaged in product designing and in developing the product vision, strategy, analytics and metrics.
- Vedant Modi is the Chief Marketing Officer of the Company. He joined our Company on June 24, 2021. He holds a bachelor’s degree in science from University College London where his main field of study was information management for business.
- Kanchan Banerjee, is the Chief Human Resources Officer of the Company. She has over 10 years’ experience in the human resources industry.
COMPETITIVE STRENGTHS
- Market leader in the Indian wedding and celebration wear market.
- Large and growing Indian wedding and celebration wear market.
- Omni-channel network of seamlessly integrated business.
- Technology-based strong supply chain and inventory systems
- Differentiated business model combining the strengths of retailing with branded consumer play
- The experienced and professional leadership team
KEY STRATEGIES
- Expansion of footprint within and outside India.
- Scaling up its emerging brands through increased up-selling and cross-selling initiatives
- Enhancement of brand appeal through targeted marketing initiatives.
KEY CONCERNS
- IPO proceeds is purely an offer for sale and company will not get benefit from such proceeds
- Dependency on third parties for some production and activities.
- Highly dependent on the on organization of weddings, festivals and other such occasions and may be affected by seasonal variations.
- Exposure to supply chain and regional risk due to geographical location of its factory and warehouse.
- Growth and profitability depend on the level of consumer confidence and spending in India and the overseas.
COMPARISON WITH LISTED INDUSTRY PEERS(AS ON 31STMARCH 2021)
There are no listed companies in India that engage in a business similar to that of the Company’s business. Accordingly, it is not possible to provide an industry comparison in relation to the Company.
FINANCIALS (RESTATED CONSOLIDATED)
Particulars (Rs. In Millions) FY 2021 FY 2020 FY 2019 Equity Share Capital247.87250.46250.46Other Equity10,666.2310,409.688,577.24 Net Worth 10,914.1010,660.148,827.70 Borrowings--0.02 Revenue from Operations 5,648.169,155.498,007.42 EBITDA 2,817.053,987.653,379.54Profit Before Tax1,819.173,118.412,709.38 Net Profit for the year 1,329.032, 366.371,764.27
DISCLAIMER:
The information contained herein are strictly confidential and are meant solely for the information of the recipient and shall not be altered in any way, transmitted to, copied or distributed, in part or in whole, to any other person or to the media or reproduced in any form, without prior written permission of Swastika Investmart Ltd. (SIL).
The contents of this document are for information purpose only. This document is not an investment advice and must not alone be taken as the basis for an investment decision. Before taking any decision to invest, the recipient of this document must read carefully the Red Herring Prospectus (‚RHP‛) issued to know the details of IPO and various risks and uncertainties associated with the investment in the IPO of the Company.
All recipients of this document must before acting on the given information/details, make their own investigation and apply independent judgment based on their specific investment objectives and financial position. They can also seek appropriate professional advice from their own legal and tax consultants, advisors, etc. to understand the risks and investment considerations arising from such investment. The investor should possess appropriate resources to analyze such investment and the suitability of such investment to such investor’s particular circumstances before making any decisions on the investment. The Investor shall be solely responsible for any action taken based on this document. SIL shall not be liable for any direct or indirect losses arising from the use of the information contained in this document and accept no responsibility for statements made otherwise issued or any other source of information received by the investor and the investor would be doing so at his/her/its own risk. The information contained in this document should not be construed as forecast or promise or guarantee or assurance of any kind. The investors are not being offered any assurance or guaranteed or fixed returns on their investments. The users of this document must bear in mind that past performances if any, are not indicative of future results. The actual returns on investment may be materially different than the past. Investments in Securities market products and instruments including in the IPO of the Company are highly risky and they are generally not an appropriate avenue for someone with limited resources/ limited investment and low risk tolerance. Such Investments are subject to market risks including, without limitation, price, volatility and liquidity and capital risks. Therefore, the users of this document must carefully consider all the information given in the RHP including the risks factors before making any investment in the Equity Shares of the Company.
Swastika Investmart Ltd or its analysts did not receive any compensation or other benefits from the companies mentioned in the report or third party in connection with preparation of the research report. Accordingly, neither Swastika Investmart Ltd nor Research Analysts have any material conflict of interest at the time of publication of this report. Compensation of our Research Analysts is not based on any specific merchant banking, investment banking or brokerage service transactions. Swastika Investment Ltd may have issued other reports that are inconsistent with and reach different conclusion from the information presented in this report. Research entity has not been engaged in market making activity for the subject company. Research analyst has not served as an officer, director or employee of the subject company. We have not received any compensation/benefits from the Subject Company or third party in connection with the Research Report.
CORPORATE & ADMINISTRATIVE OFFICE - 48, Jaora Compound, M.Y.H. Road, Indore - 452 001 | Phone 0731 - 6644000
Compliance Officer: Ms. Sheetal Duraphe Email: compliance@swastika.co.inPhone: (0731) 6644 241
Swastika Investmart Limited, SEBI Reg. No. : NSE/BSE/MSEI: INZ000192732 Merchant Banking: INM000012102 Investment Adviser: INA000009843 MCX/NCDEX: INZ000072532 CDSL/NSDL: IN-DP-115-2015 RBI Reg. No.: B-03-00174 IRDA Reg. No.: 713.


.webp)
.webp)

.webp)


START YOUR INVESTMENT JOURNEY
Get personalized advice from our experts
- Dedicated RM Support
- Smooth and Fast Trading App
